Conducted GIS & Remote Sensing Tools based assessment of A-Grade Municipalities and District Councils to Identify the most Climate vulnerable municipalities and District Council of Bangladesh.
Programme title: Municipal Investment Finance (MiF) of United Nations Capital Development Fund(UNCDF) , by Z M Sajjadul Islam
1.0 Glossary:
2.0 Introduction:
3.0 Context of Climate induced hazard
4.0 Methodological approach of assessment of Vulnerability of A-type Municipality:
4.1 Identification of Vulnerable A-Type Municipality:
4.1.1 Location map of all A-type Municipality and selected vulnerable of Municipality(A-type) of Bangladesh
4.2 Division wise GIS analysis and selection of vulnerable Municipality :
4.2.1 Vulnerability analysis of A-type Municipality of Rajshahi Division
4.2.2 Vulnerability analysis of A-type Municipality of Rangpur Division:
4.2.3 Vulnerability analysis of A-type Municipality of Sylhet Division :
4.2.4 Vulnerability analysis of A-type Municipality of Mymensingh Division :
4.2.5 Vulnerability analysis of A-type Municipality of Dhaka Division:
4.2.6 Vulnerability analysis of A-type Municipality of Khulna Division:
4.2.7 Vulnerability analysis of A-type Municipality of Barisal Division:
4.2.8 Vulnerability analysis of A-type Municipality of Chottagram Division:
4.3. Vulnerability analysis with other variables ( HIES 2011, NCVA, Literacy, WB Poverty, general employment )
4.3.1 Analysis of vulnerability in terms of exposure of heat stress in the future ( 2070-2099) :
4.3.2 Poverty analysis with World Bank head count poverty data ( Upazila wise)
4.3.3 Primary employment on service
4.3.4 Municipality wise Literacy rate
5.0 5.0 Selecting vulnerable District Council
5.1 District wise ratio of poverty ( District wise head count ratio of World Bank)
5.2 District Poverty ranking and selection ( Source : District wise poverty head count ratio which published in World Bank website in November 10, 2016 )
5.3 Selection of 16 District Councils from rank
5.4 GIS Maps on selected 16 District Councils from rank
6.0 Reference
Acronym :
CEGIS Center for Environmental and Geographic Information Services (CEGIS)
DDM Department of Disaster Management
GIZ Deutsche Gesellschaft für Internationale Zusammenarbeit
HIES Household Income & Expenditure Survey (HIES)
IPCC Intergovernmental Panel on Climate Change
IPUMS Integrated Public Use Microdata Series project
LGED Local Government Engineering Department
NCVA nationwide climate vulnerability assessment
NWRD National Water Rescue Database
Glossary :
Adaptation :
The process of adjustment to actual or expected climate and its effects. In human systems, adaptation seeks to moderate harm or exploit beneficial opportunities. In natural systems, human intervention may facilitate adjustment to expected climate and its effects. See also Autonomous adaptation, Evolutionary adaptation, and Transformation
Adaptive capacity:
Coping capacity:
The ability of people, institutions, organizations, and systems, using available skills, values, beliefs, resources, and opportunities, to address, manage, and overcome adverse conditions in the short to medium term. This glossary entry builds from the definition used in UNISDR (2009) and IPCC (2012a).
Exposure :The presence of people, livelihoods, species or ecosystems, environmental services and resources, infrastructure, or economic, social, or cultural assets in places that could be adversely affected
Hazard :
The potential occurrence of a natural or human-induced physical event or trend, or physical impact, that may cause loss of life, injury, or other health impacts, as well as damage and loss to property, infrastructure, livelihoods, service provision, and environmental resources. In this report, the term hazard usually refers to climate related physical events or trends or their physical impacts.
Sensitivity:
The degree to which a system or species is affected, either adversely or beneficially, by climate variability or change. The effect may be direct (e.g., a change in crop yield in response to a change in the mean, range, or variability of temperature) or indirect (e.g., damages caused by an increase in the frequency of coastal flooding due to sea-level rise).
Vulnerability :
The propensity or predisposition to be adversely affected. Vulnerability encompasses a variety of concepts including sensitivity or susceptibility to harm and lack of capacity to cope and adapt.
2.0 Introduction :
In Bangladesh Municipality (Municipal Corporations) known as Paurasabha which are the local governing bodies of the cities and towns in Bangladesh. There are 329 Municipality in eight divisions of Bangladesh. Municipality being categorized(type) as A , B & C based on the infrastructures , sprawling status and economical performance. According to LGED 183 A-type Municipally out of 329.
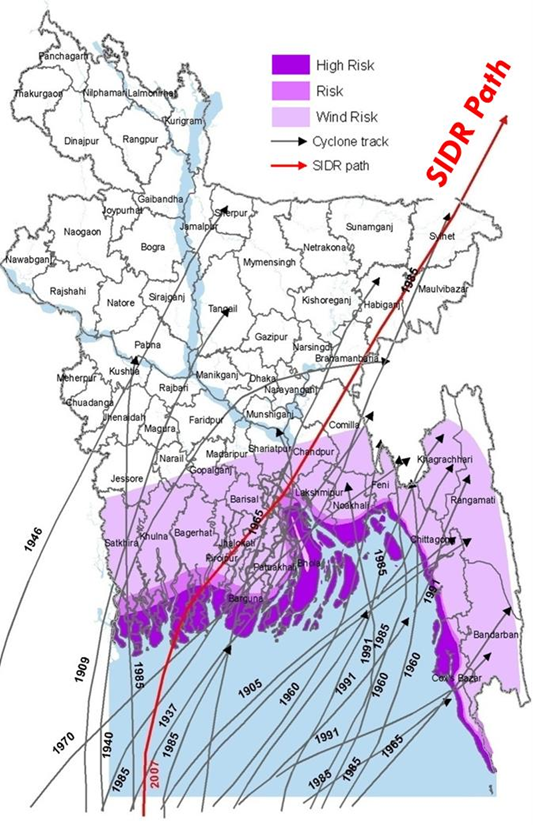
3.0 Context of Climate induced hazard:
Hazard can be defined according to IPCC AR5 as the potential occurrence of a natural or human-induced physical event or trend or physical impact that may cause loss of life, injury, or other health impacts, as well as damage and loss to property, infrastructure, livelihoods, service provision, ecosystems, and environmental resources. In this report, the term hazard usually refers to climate-related physical events or trends or their physical impacts.
Due to climate change Bangladesh is now susceptible to frequent and longer period flooding, drought, sea level rise, frequent cyclone and storm surge, flash floods, etc. The country’s exposure to hazards is compounded by its population’s vulnerability and lack of resources. The mostly agrarian economy and the high population density leave large sections of the population exposed to hazards. The United Nation’s (UN) 2014 World Risk Report named Bangladesh the 7th most ‘at risk’ country( German watch 2018) for disaster in the world.
- Flood is an annual phenomenon generally affecting 30 per cent of the country, but up to 70 per cent in extreme years. Flood-related fatalities are decreasing, but economic losses have been increasing over the years. The government has been developing and implementing various measures to better equip the country to deal with floods. Important initiatives include the flood action plan, flood hydrology study, flood management model study, national water management plan, national water policy, flood early warning study and construction of flood embankments and flood shelters. The flood damage potential is increasing due to climate change, urbanization, growth of settlements in flood-prone areas and overreliance on flood control works such as levees and reservoirs.
- Flash floods occur during mid-April before the onset of the south-westerly monsoon. In particular, flash floods can decimate an annual rice crop when they occur at harvest time. Crop decimation occurred four times between 2004 and 2014 in the Haor region. The city of Sylhet is also prone to flash floods.
- Rain-fed floods generally happen in the deltas in the south-western part of the country and are increasing in low-lying urban areas. In 1988, record floods inundated 250 square kilometres (sq km) of Dhaka for 3 weeks. Chittagong also experiences monsoon related floods.
- River floods are the most common; the areas are inundated during monsoon season along the river and in cases far beyond the riverbanks. Extreme flooding occurs when the rivers flood at the same time, or when the rivers flood during a heavy monsoon. For example, in 2012 Bangladesh’s northern region experienced a shorter than average flood period, while the southwestern region of the country experienced flooding for 49 days.
- Storm surge floods occur along the coastal areas of Bangladesh, which has a coastline of about 800 km northern part of Bay of Bengal
- Drought is seasonal in north-western parts of Bangladesh experience drought in the crop season. During the last 50 years, Bangladesh suffered about severe 20 drought episodes. As much as 20 per cent of the main crop – wet season paddy – may be lost in a typical year due to drought. Drought-prone areas are also affected by cold waves with impacts on human health. There is opportunity for supporting resilience to drought through institutional initiatives. The consultations for developing NPDM 2016-2020 strongly suggested the need for addressing drought though structural and non-structural measures.
- Severe cyclones with storm surges sometimes in excess of ten meters frequently impact Bangladesh’s low-lying coast. GoB has a well-coordinated cyclone forecasting, early warning and evacuation system and the cyclone mortality rate has been reduced greatly from 300,000 in 1971 to 138,882 in 1991 for the same category of cyclone. However, growing and higher concentration of assets has resulted in increasing economic losses. Tornadoes are seasonal and occur in the pre-monsoons season. The frequency of tornadoes in Bangladesh is among the highest in the world. The Brahmanaria tornado of 2013 struck 20 villages and killed 31 people and injured around 500 in Brahmanbaria district.
- Riverbank erosion is a common problem in Bangladesh due to the deltaic topography and it has been forcing people to migrate or resettle. Riverbank erosion has rendered millions homeless; the majority of slum dwellers in large urban and metropolitan towns and cities are victims of erosion. The major rivers like the Jamuna, the Ganges, the Padma, the Lower Meghna, Arial Khan and Teesta are highly erosion-prone. Structural interventions are costly and need to be complemented by non-structural measures, such as erosion prediction and warning. From 2005, prediction activities were funded by the Jamuna-Meghna River Erosion Mitigation Project (JMREMP) and EMIN project of the BWDB and WARPO, and in 2008, by UNDP.
- Salinity intrusion is an increasing hazard in the coastal areas of Bangladesh, posing a threat to ecosystems, livelihoods and public health and diminishing access to freshwater for household and commercial use. About 20 million people in the coastal areas of Bangladesh are affected by salinity in their drinking water. Bangladesh Water Development Board (BWDB) undertook studies on groundwater availability and found in some coastal districts there was no freshwater layer as deep as 300 meters; in many cases, saline water was found in aquifers at 200 meters.
4.0 Methodological approach of assessment of Vulnerability of A-type Municipality:
Typically quantitative assessment of vulnerability implies that the first two components together represent the potential impact and adaptive capacity is the extent to which these impacts can be averted. Thus vulnerability is calculated by potential impact (PI) minus adaptive capacity (AC). e.g.
Formula : Vulnerability(V) = Potential impact (PI) [Exposure (E) + Sensitivity (S)] – Adaptive Capacity (AC)
Calculation of vulnerable Municipality ( V) = PI [Spatial Intensity of Multi-hazard ( E+S)] – AC (Ranking of % Poverty, % literacy, % employment ).
Main weightage given to spatial distribution of physical hazards (expose & sensitivity in the context of landscape) which occurs in geographical position geo-physical settings, global and regional climatic context etc., and this principal variable being generalized by other socio-economical attributes from census survey)
Sources of datasets used :
Based on available datasets on spatial distribution of hazards in Bangladesh from available secondary sources e.g
- A-type Municipality data from LGED website.
- Multi hazards: National Water Rescue Database ( NWRD, 2011), Bangladesh Delta Plan(BDP) 2100 (BDP2100 study in 2018 ), CEGIS multi-hazard GIS analytical maps (2016), GIZ conducted CVRA Dec. 2018, DDM Risk Atlas Oct, 2016 etc.
- Field varication also being carried by secondary sources e.g satellite image (google earth, Microsoft bing image map) for verifying the geographical position of Municipality and proximity to climatic hotspot.
- Social vulnerability attribute information from BBS Census survey 2011, HIES (municipality statistics, Municipality wise literacy rate, and world Bank headcount poverty data – prepared in November 2016 (combined by the 2010 Bangladesh Poverty Maps, the IPUMS sample from the 2011 Bangladesh Census of Population and Housing, and the 2012 Undernutrition Maps of Bangladesh) , Primary employment: Services, National avg (%)
4.1 Identification of Vulnerable A-Type Municipality:
Considering the geographical settings, and recurrently and historically occurrence of hazards all over the country being synthesized and analized with GIS Maps (GIS Map & data from secondary source), and verification done by overlying hotspot on the ESRI satellite image (world bing image) with ArcGIS software. Total 183 A-Type Municipality inserted as layer and superimposed over the multi-hazard layer on GIS analytical map for getting the vulnerability type and factor.
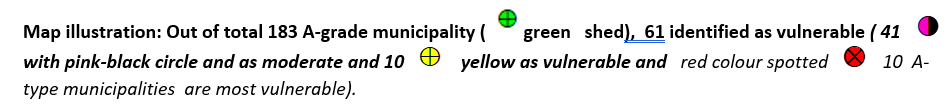
Multiple factors being e.g. topographical characteristics, riverine morphology, geographical position, intensity & frequency of the occurrence of hazard etc being considered for selection of vulnerable 61, moderate vulnerable 41 and most vulnerable 10 of A-grade municipality. The closest proximity to climatic hotspots, severity of exposure & vulnerability being further considered for choosing 10 most vulnerable A-grade municipality .
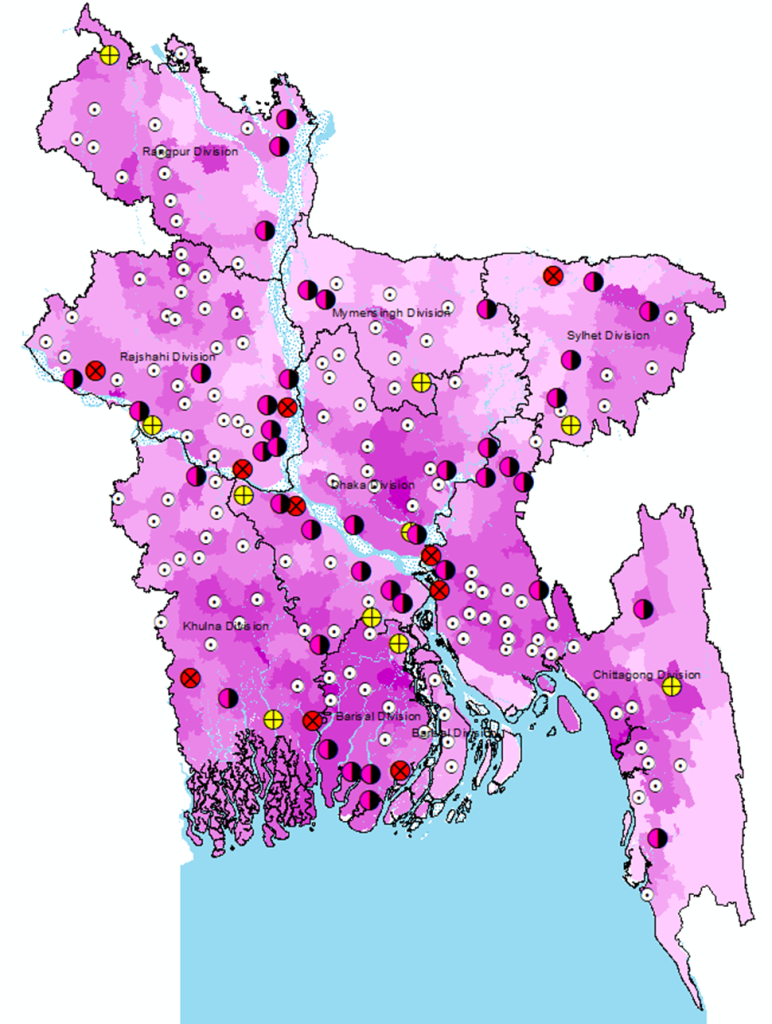
4.1.1 Location map of all A-type Municipality and selected vulnerable of Municipality(A-type) of Bangladesh
Figure 1 : A-Type Municipality(Pourashava) classified by severity of natural hazards ( Note : Stress the map for more clear view)
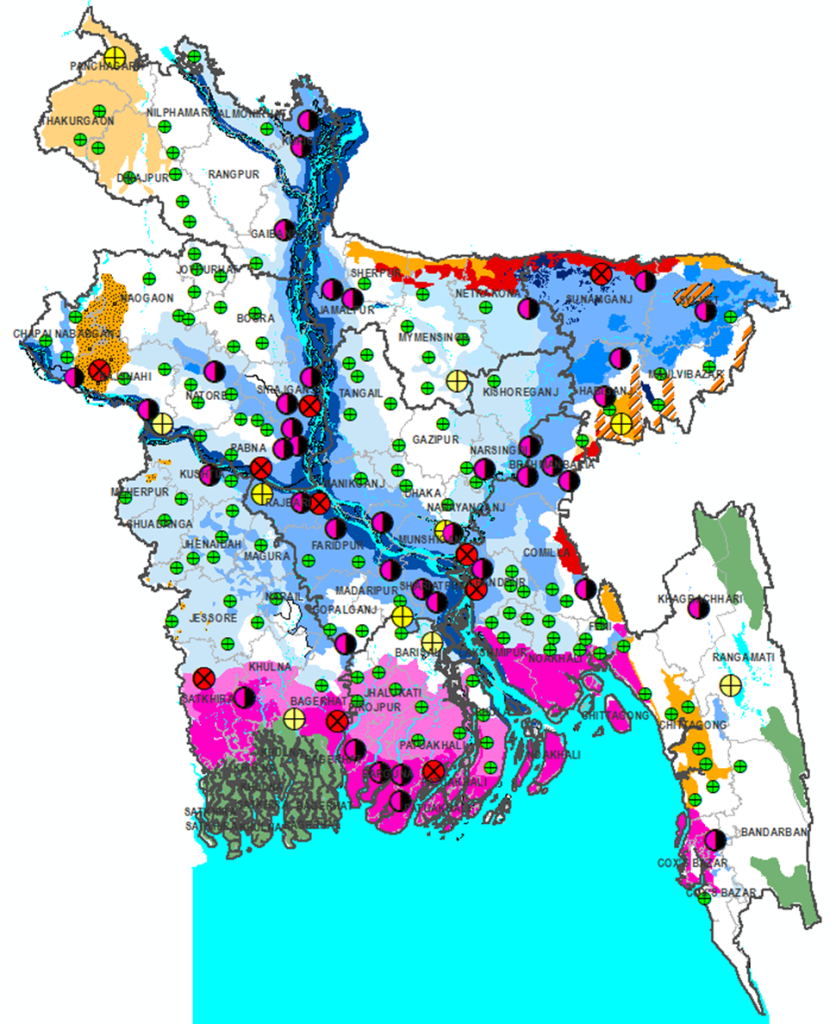
Data Source: a) National Water Rescue Database ( NWRD, 2011), Bangladesh Delta Plan(BDP) 2100, CEGIS, Prepared by Z M Sajjadul Islam
- Division wise GIS analysis and selection of vulnerable Municipality :
4.2.1 Vulnerability analysis of A-type Municipality of Rajshahi Division:
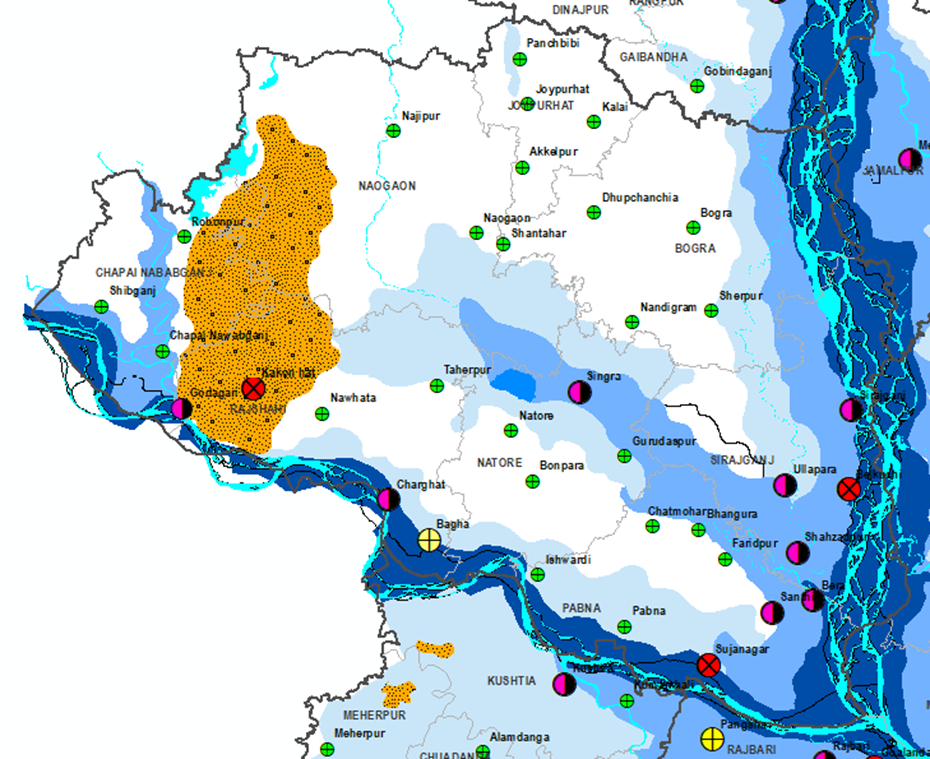
Figure 2 : Map Rajshahi Division, Prepared by Z M Sajjadul Islam
Table 1 : Most Vulnerable Municipality from Rajshahi Division
Kakonhat municipality located in the Barind track region and falling under drought of Bangladesh. Other two most vulnerable municipality spotted as Sujanagar of Pabna and Belkuchi of Sirajganj because affected by multiple hazards riverine Flood & Erosion.
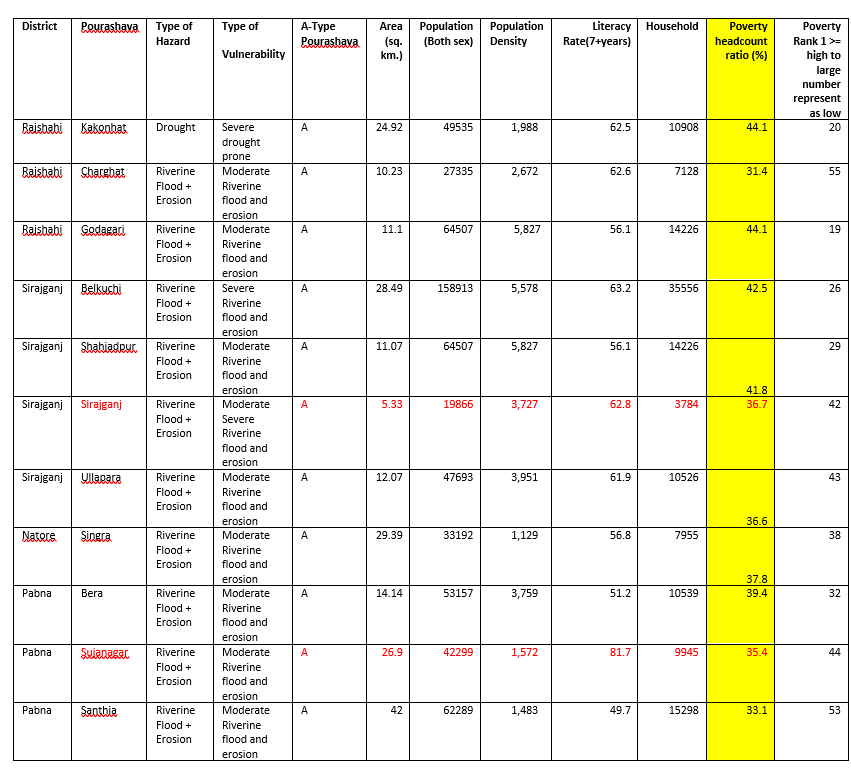
4.2.2 Vulnerability analysis of A-type Municipality of Rangpur Division:
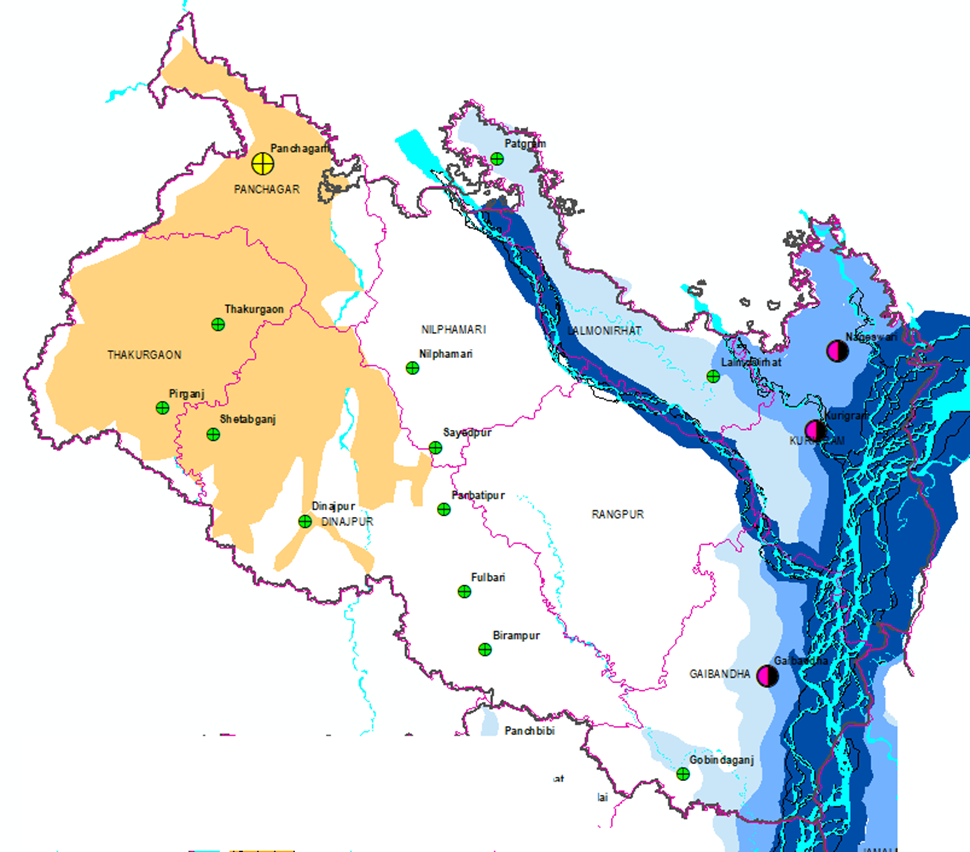
Figure 3 : Map Rangpur Division, Prepared by Z M Sajjadul Islam
Table2 : Moderate Vulnerable Municipality from Rangpur Division
| District | Municipality | Type of Hazard | Type of Vulnerability | Area (sq. km.) | Population (Both sex) | Population Density | Literacy Rate(7+years) | Household | % population affected by NatHaz | Poverty headcount ratio (%) | Rank 1 >= high to large number represent as low |
| Kuragram | Kurigram | Riverine Flood + Erosion | Moderate | 27 | 77252 | 2,857 | 63.2 | 17159 | 56% | 58.0 | 2 |
| Panchagarh | Panchagarh | Riverine, Moderate flash flood | Moderate | 5.53 | 16017 | 2,896 | 65.9 | 3788 | 38% | 24.2 | 71 |
| Kurigram | Nageswari | Riverine, Moderate flash flood | Moderate | 13.32 | 102988 | 7,732 | 74.8 | 23037 | 65.0 | 13.32 | 1 |
| Gaibandha | Gaibandha | Riverine, Moderate flash flood | Moderate | 3.39 | 9 | 21200 | 6,254 | 71.5 | 4967 | 44.8 | 16 |
Data source : a) BBS HIES 2011, National Report-Vol 3, Urban area report in August 2014, b) % of Pop affected by national hazards of GIZ NCVA (nationwide climate vulnerability assessment in Bangladesh) , Dec 2018, c) Head county poverty data of World Bank ( published in World Bank website in November 10, 2016 )
Kurigram municipality geographically located on the bank of Dharla river. In case of 1998 floods this township experience flooding over the eastern part. Pachagarh municipality experience moderate flash flood when monsoon characterized by torrential precipitation on the upstream basin .
4.2.3 Vulnerability analysis of A-type Municipality of Sylhet Division :
Figure 4: Map Sylhet Division, Prepared by Z M Sajjadul Islam
Table 3: Severe and Moderate Vulnerable A-type Municipality of Sylhet Division
| District | Municipality | Type of Hazard | Type of Vulnerability | Area (sq. km.) | Population (Both sex) | Population Density | Literacy Rate(7+years) | Household | % population affected by NatHaz | Poverty headcount ratio (%) | Rank 1 >= high to large number represent as low |
| Sunamganj | Sunamganj | Flash Flood + Erosion | Severe flash & riverine flooding and erosion | 11.1 | 25461 | 2,298 | 44.6 | 5833 | 49 | 25.1 | 70 |
| Sunamganj | Chhatak | Flash Flood + Erosion | Severe to Moderate | 17.3 | 65332 | 3,774 | 60.5 | 11926 | 47% | 23.6 | 74 |
| Habiganj | Chunarughat | Flash Flood + Erosion | Moderate | 16.5 | 9 | 32444 | 1,966 | 62.2 | 5652 | 27.5 | 68 |
| Habiganj | Nabiganj | Riverine Flood + Erosion | Moderate | 9.37 | 9 | 34015 | 3,630 | 68.9 | 6416 | 26.8 | 70 |
| Habiganj | Habiganj | Riverine Flood + Erosion | Moderate | 8.97 | 9 | 69512 | 7,749 | 71.3 | 13517 | 16.9 | 89 |
| Sylhet | Golapganj | Riverine | Moderate | 4.98 | 20019 | 4,020 | 79.3 | 3985 | 44 | 14.9 | 81 |
Data source : a) BBS HIES 2011, National Report-Vol 3, Urban area report in August 2014, b) % of Pop affected by national hazards of GIZ NCVA (nationwide climate vulnerability assessment in Bangladesh) , Dec 2018, c) Head county poverty data of World Bank ( published in World Bank website in November 10, 2016 )
Sunamganj is the most vulnerable A-type municipality beside Chatak under Sylhet Division. In every given season this township experience flash flooding and localized riverine flooding. Chatak and Golapganj considered as moderate vulnerable municipality.
4.2.4 Vulnerability analysis of A-type Municipality of Mymensingh Division :
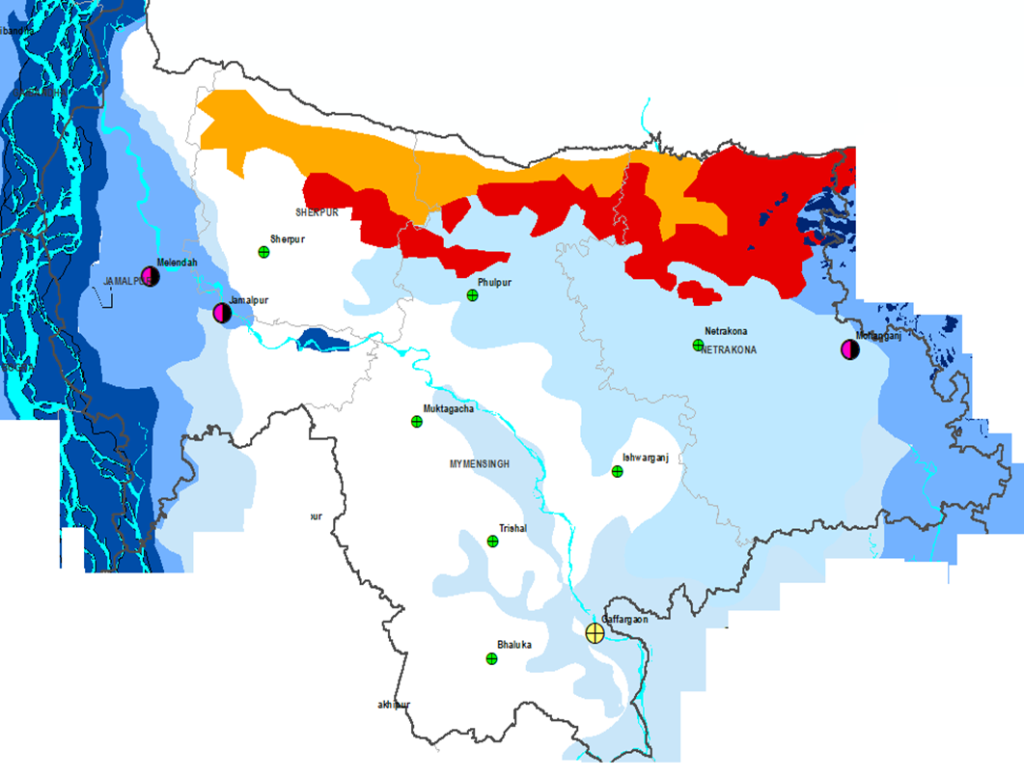
Figure 5: Map Mymensing Division, Prepared by Z M Sajjadul Islam
Table 4: Severe and Moderate Vulnerable A-type Municipality of Sylhet Division
| District | Municipality | Type of Hazard | Type of Vulnerability | Area (sq. km.) | Population (Both sex) | Population Density | Literacy Rate(7+years) | Household | Poverty headcount ratio (%) | Rank 1 >= high to large number represent as low |
| Jamalpur | Jamalpur | Riverine Flood + Erosion | Moderate | 53.3 | 142764 | 2,718 | 62.1 | 35619 | 49.8 | 8 |
| Jamalpur | Melandaha | Riverine Flood + Erosion | Moderate | 19.25 | 16569 | 861 | 44.4 | 3997 | 47.2 | 12 |
| Netrokona | Mohanganj | Riverine Flood + Erosion | Moderate | 6.97 | 27193 | 3,901 | 65.8 | 5786 | 34.3 | 47 |
| Mymensingh | Gafargaon | Riverine Flood + Erosion | Moderate | 5.39 | 29325 | 5,441 | 67.7 | 6513 | 43.9 | 21 |
Data source : a) BBS HIES 2011, National Report-Vol 3, Urban area report in August 2014, b) % of Pop affected by national hazards of GIZ NCVA (nationwide climate vulnerability assessment in Bangladesh) , Dec 2018, c) Head county poverty data of World Bank ( published in World Bank website in November 10, 2016 )
4.2.5 Vulnerability analysis of A-type Municipality of Dhaka Division:
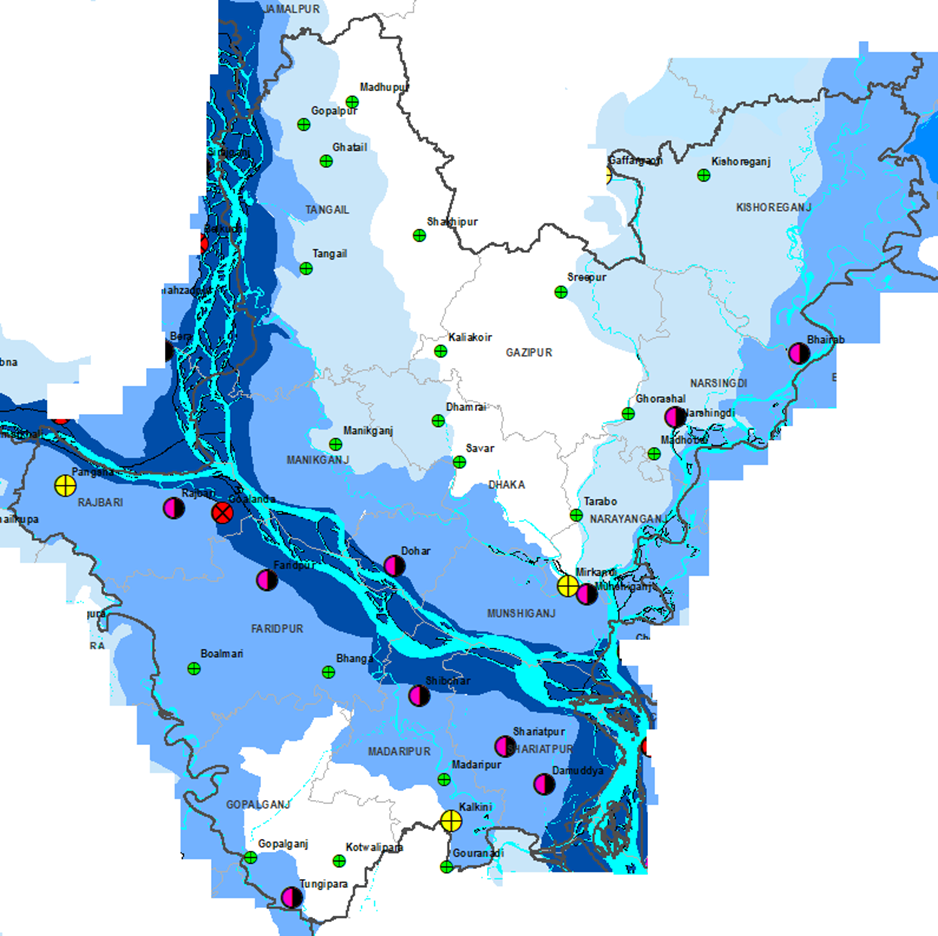
Figure 6: Map Dhaka Division, Prepared by Z M Sajjadul Islam
Table 5: Severe and Moderate Vulnerable A-type Municipality of Dhaka Division
| District | Municipality | Type of Hazard | Type of Vulnerability | Area (sq. km.) | Population (Both sex) | Population Density | Literacy Rate(7+years) | Household | Poverty headcount ratio (%) | Rank 1 >= high to large number represent as low |
| Rajbari | Goalanda | Riverine Flood + Erosion | Severe | 27.2 | 59148 | 2,179 | 63.3 | 11460 | 50.5 | 5 |
| Dhaka | Dohar | Riverine Flood + Erosion | Moderate | 7.99 | 19651 | 2,459 | 55.9 | 3889 | 23.9 | 36 |
| Shariatpur | Damuddya | Riverine Flood + Erosion | Moderate | 8.02 | 24154 | 3,012 | 65.9 | 5527 | 47.9 | 10 |
| Madaripur | Shibchar | Riverine Flood + Erosion | Moderate | 43.9 | 98355 | 2,239 | 65.9 | 22105 | 38.8 | 32 |
| Faridpur | Faridpur | Riverine Flood + Erosion | Moderate | 10.5 | 21914 | 2,087 | 63.6 | 5276 | 33.9 | 48 |
| Munshiganj | Munshiganj | Riverine Flood + Erosion | Moderate | 12.95 | 31,320 | 2,418.53 | 45.7 | 7615 | 30.8 | 59 |
| Narsingdi | Narsingdi | Riverine Flood + Erosion | Moderate | 14.75 | 185128 | 40,661 | 64.4 | 8837 | 22.8 | 82 |
| Rajbari | Rajbari | Riverine Flood + Erosion | Moderate | 32.39 | 113322 | 3,499 | 69.3 | 26896 | 38.7 | 35 |
| Shariatpur | Shariatpur | Riverine Flood + Erosion | Moderate | 24.92 | 49535 | 1,988 | 62.5 | 10908 | 49.8 | 8 |
| Gopalganj | Tungipara | Riverine Flood + Erosion | Moderate | 4.85 | 18663 | 3,848 | 58.5 | 4156 | 42.6 | 25 |
| Kishoreganj | Bhairab | Riverine Flood + Erosion | Moderate | 10.5 | 9 | 21914 | 2,087 | 63.6 | 5276 | 33.9 |
Data source : a) BBS HIES 2011, National Report-Vol 3, Urban area report in August 2014, b) % of Pop affected by national hazards of GIZ NCVA (nationwide climate vulnerability assessment in Bangladesh) , Dec 2018, c) Head county poverty data of World Bank ( published in World Bank website in November 10, 2016 )
Goalanda municipality annexed to a grater confluence of Padma and Brahmaputra river and highly vulnerable to multiple hazards Riverine Flood & Erosion
4.2.6 Vulnerability analysis of A-type Municipality of Khulna Division:
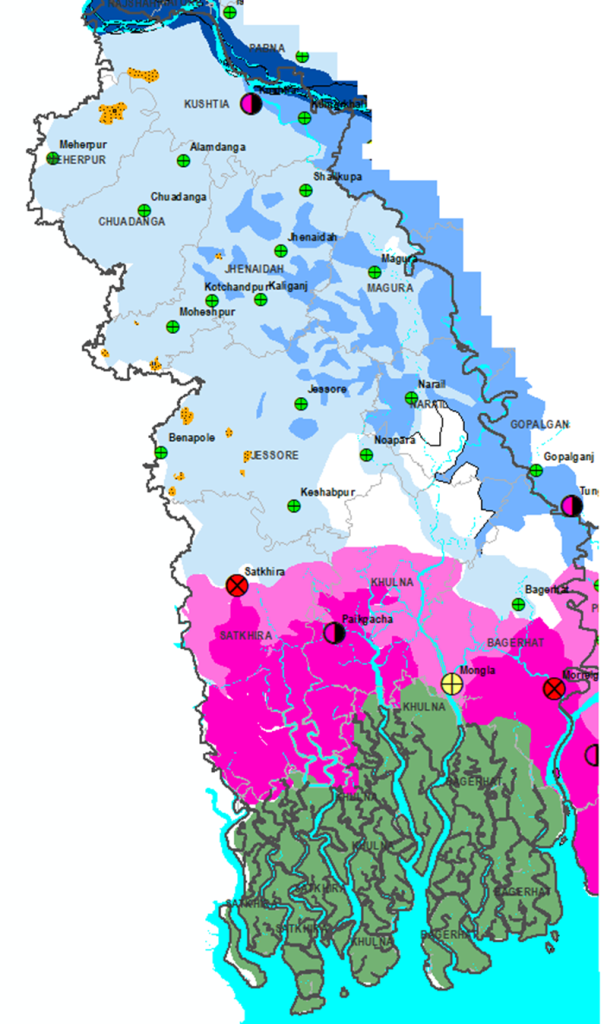
Figure 7: Map Kuhulna Division, Prepared by Z M Sajjadul Islam
Table 6: Severe and Moderate Vulnerable A-type Municipality of Khulna Division
| District | Municipality | Type of Hazard | Type of Vulnerability | Area (sq. km.) | Population (Both sex) | Population Density | Literacy Rate(7+years) | Household | Poverty headcount ratio (%) | Rank 1 >= high to large number represent as low |
| Bagerhat | Morrelganj | Tidal surge, High Salinity, Sea level raise (SLR) | Severe | 17.6 | 172017 | 9,774 | 66 | 33517 | 46.5 | 12 |
| Khulna | Paikgacha | Tidal surge, High Salinity, Sea level raise (SLR) | Moderate | 27.78 | 41608 | 1,498 | 55.3 | 8815 | 42.4 | 26 |
| Satkhira | Satkhira | Tidal surge, High Salinity, Sea level raise (SLR) | Severe | 6.35 | 23314 | 3,671 | 57.5 | 4513 | 43.1 | 22 |
| Kushtia | Kushtia | Riverine flood and erosion | Moderate | 6.53 | 20522 | 3,143 | 60.3 | 4218 | 3.0 | 99 |
Data source : a) BBS HIES 2011, National Report-Vol 3, Urban area report in August 2014, b) % of Pop affected by national hazards of GIZ NCVA (nationwide climate vulnerability assessment in Bangladesh) , Dec 2018, c) Head county poverty data of World Bank ( published in World Bank website in November 10, 2016 )
From the analysis Morrelganj of Bagerhat District identified as most vulnerable over the southern bay proximity and similarly Satkhira surrounded by multiple hazards as well in terms of SLR, salinity intrusion and recent cyclonic tract to this region.
4.2.7 Vulnerability analysis of A-type Municipality of Barisal Division:
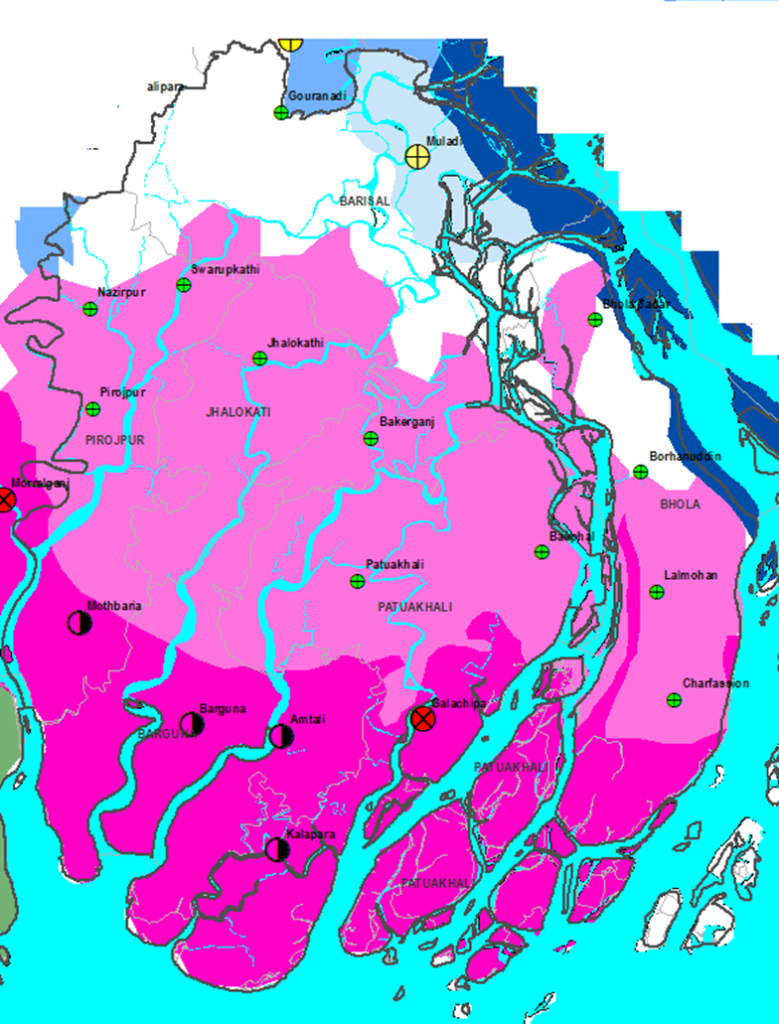
Figure 8: Map Barisal Division ( legend from Bangladesh map ), Prepared by Z M Sajjadul Islam
Table 7 : Severe and Moderate Vulnerable A-type Municipality of Khulna Division
| District | Municipality | Type of Hazard | Type of Vulnerability | Area (sq. km.) | Population (Both sex) | Population Density | Literacy Rate(7+years) | Household | % population affected by NatHaz | Poverty headcount ratio (%) | Rank 1 >= high to large number represent as low |
| Patuakhali | Galachipa | Tidal surge & Salinity, Sea level raise (SLR) | Severe | 12.57 | 29098 | 2,315 | 67.7 | 6569 | 58 | 26.0 | 67 |
| Patuakhali | Kalapara | Moderate tidal surge & Salinity, Sea level raise (SLR) | Moderate | 9.95 | 55323 | 5,560 | 64.3 | 10613 | 56 | 20.3 | 77 |
| Barguna | Barguna | High tidal surge+ moderate Salinity, Sea level raise (SLR) | Moderate | 15.57 | 32235 | 2,070 | 75.9 | 7353 | 47 | 19.2 | 78 |
| Pirojpur | Mathbaria | High tidal surge+ moderate Salinity, Sea level raise (SLR) | Moderate | 29.41 | 27700 | 942 | 53.8 | 6541 | 44 | 38.0 | 35 |
Data source : a) BBS HIES 2011, National Report-Vol 3, Urban area report in August 2014, b) % of Pop affected by national hazards of GIZ NCVA (nationwide climate vulnerability assessment in Bangladesh) , Dec 2018, c) Head county poverty data of World Bank ( published in World Bank website in November 10, 2016 )
Two municipality under Barisal division are highly vulnerable in terms of proximity to river and bay. The Galachipa Municipality under Patuakhai District identified as most vulnerable municipality and Amtali under Barguna District considered as high- to- moderate vulnerable, but the landscape and infrastructures of the township is better than Galachipa and Kalapara.
4.2.7 Vulnerability analysis of A-type Municipality of Chottagram Division:
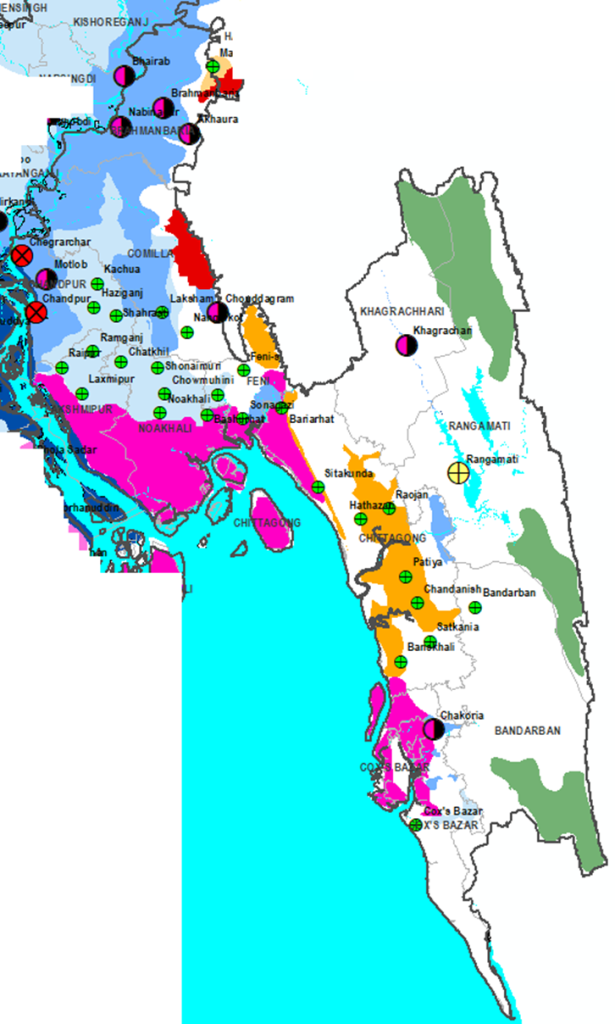
Figure 9: Map Chottagram Division, Prepared by Z M Sajjadul Islam
Table 8 : Severe and Moderate Vulnerable A-type Municipality of Chittagong Division
| District | Municipality | Type of Hazard | Type of Vulnerability | Area (sq. km.) | Population (Both sex) | Population Density | Literacy Rate(7+years) | Household | Poverty headcount ratio (%) | Rank 1 >= high to large number represent as low |
| Chandpur | Chandpur | Riverine Flooding & severe erosion | Severe | 5.13 | 20606 | 4,017 | 56.6 | 4712 | 45.5 | 14 |
| Chandpur | Chengerchar | Riverine Flooding & severe erosion | Severe | 22.66 | 47477 | 2,095 | 76 | 9635 | 49.9 | 6 |
| Khagrchhari | Khagrachhari | Flash and Riverine Flooding | Moderate | 13.1 | 47278 | 3,623 | 71 | 10247 | 19.5 | 85 |
| Cumilla | Chouddagram | Riverine/Flash Flood | Moderate | 11.98 | 44364 | 3,703 | 55.6 | 7824 | 34.4 | 42 |
| Cox Bazar | Chakaria | Riverine/Flash Flood | Moderate | 27.23 | 36691 | 7,884 | 59.2 | 7884 | 28.5 | 56 |
| Brahmanbaria | Nabinagar | Riverine Flooding | Moderate | 12.4 | 34148 | 2,747 | 61.5 | 7505 | 30.5 | 54 |
| Brahmanbaria | Akhaura | Riverine Flooding | Moderate | 16.4 | 50068 | 3,049 | 52.2 | 11012 | 26.9 | 63 |
| Brahmanbaria | Brahmanbaria | Riverine Flooding | Moderate | 15.7 | 118992 | 7,574 | 53.6 | 24057 | 26.0 | 71 |
| Chandpur | Matlab | Riverine Flooding | Moderate | 13.4 | 27595 | 2,056 | 54.6 | 6016 | 51.5 | 5 |
Data source : a) BBS HIES 2011, National Report-Vol 3, Urban area report in August 2014, b) % of Pop affected by national hazards of GIZ NCVA (nationwide climate vulnerability assessment in Bangladesh) , Dec 2018, c) Head county poverty data of World Bank ( published in World Bank website in November 10, 2016 )
Most vulnerable municipalities are Chengerchar and Chandpur of Chandpur district for positioning at the bank of Meghna and recurrently experience multiple hazards Riverine flooding erosion. Among the other vulnerable districts Khagrachari which heavily being impacted by flash and riverine floods and its becoming recurrent over the past 10 years during monsoon season.
| Table 9: Selected 10 Most vulnerable Municipality : Data source : BBS HIES 2011, National Report-Vol 3, Urban area report in August 2014 | |||||||||||||
| SL | Division | District | Municipality/ Pourashava | A-Type Pourashava | Area (sq. km.) | Population (Both sex) | Population Density | Literacy Rate (7+years) | Household | Poverty headcount ratio (%) | Poverty Rank 1 >= high to large | Multi Hazard | Proximity to climatic hotspot(River, Sea and others) |
| 1 | Khulna | Bagerhat | Morrelganj | A | 17.6 | 172017 | 9,774 | 66 | 33517 | 46.5 | 12 | Moderate tidal Flooding | Boleshwar River |
| 2 | Chattogram | Chandpur | Chengarchar | A | 22.66 | 47477 | 2,095 | 76 | 9635 | 49.9 | 6 | Severe river Flooding | Beside Meghna |
| 3 | Chattogram | Chandpur | Chandpur | A | 5.13 | 20606 | 4,017 | 56.6 | 4712 | 45.5 | 14 | Severe river Flooding | Beside Meghna |
| 4 | Rajshahi | Pabna | Sujanagar | A | 26.9 | 42299 | 1,572 | 81.7 | 9945 | 35.4 | 40 | Severe river Flooding | Beside Padma, Severe flood prone |
| 5 | Barishal | Patuakhali | Galachipa | A | 12.57 | 29098 | 2,315 | 67.7 | 6569 | 26.0 | 67 | Severe tidal flooding | Beside Galachipa |
| 6 | Dhaka | Rajbari | Goalanda | A | 27.15 | 59148 | 2,179 | 63.3 | 11460 | 50.5 | 5 | Severe river Flooding | |
| 7 | Rajshahi | Rajshahi | Kakonhat | A | 24.92 | 49535 | 1,988 | 62.5 | 10908 | 44.1 | 19 | Severe Dorught Prone | Severe Dorught Prone |
| 8 | Khulna | Satkhira | Satkhira | A | 6.35 | 23314 | 3,671 | 57.5 | 4513 | 43.1 | 22 | Moderate Tidal Flooding | SLR, Tidal Floods, Salinity |
| 9 | Rajshahi | Sirajganj | Belkuchi | A | 28.49 | 158913 | 5,578 | 63.2 | 35556 | 42.5 | 25 | Severe River Flooding | Beside Brahmaputra River |
| 10 | Sylhet | Sunamganj | Sunamganj | A | 11.08 | 25461 | 2,298 | 44.6 | 5833 | 25.1 | 70 | Severe Flash Flooding | Confluence of Surma and Wahumgi river |
| Table 10: Selected 41 A- type Moderate Vulnerable Municipalities | ||||||||||||||
| SL | Division | District | Pourashava | A-Type Pourashava | Area (sq. km.) | Ward | Population (Both sex) | Population Density | Literacy Rate(7+years) | Household | Poverty headcount ratio (%) | Poverty Rank 1 >= high to large number as low | Multi Hazard | Proximity to climatic hotspot(River, Sea and others) |
| Barishal | Barguna | Amtali | A | 6.22 | 9 | 15418 | 2,479 | 76.7 | 3395 | 22.8 | 83 | Severe tidal flooding | Beside Payra River | |
| Barishal | Barguna | Barguna | A | 15.57 | 9 | 32235 | 2,070 | 75.9 | 7353 | 19.2 | 86 | Severe tidal flooding | Between Payra & BishKhali River | |
| Chattogram | Brahmanbaria | Akhaura | A | 16.42 | 9 | 50068 | 3,049 | 52.2 | 11012 | 26.9 | 69 | Moderate river Flooding | Beside Titas riiver | |
| Chattogram | Brahmanbaria | Nabinagar | A | 12.43 | 9 | 34148 | 2,747 | 61.5 | 7505 | 30.5 | 60 | Moderate river Flooding | Beside Meghna | |
| Chattogram | Brahmanbaria | Brahmanbaria | A | 15.71 | 9 | 118992 | 7,574 | 53.6 | 24057 | 26.0 | 71 | Moderate river Flooding | ||
| Chattogram | Chandpur | Matlab | A | 13.42 | 9 | 27595 | 2,056 | 54.6 | 6016 | 51.5 | 5 | Moderate river Flooding | ||
| Chattogram | Cox’s Bazar | Chakoria | A | 27.23 | 9 | 36691 | 7,884 | 59.2 | 7884 | 28.5 | 62 | Moderate river Flooding | ||
| Chattogram | Cumilla | Chouddagram | A | 11.98 | 9 | 44364 | 3,703 | 55.6 | 7824 | 34.4 | 46 | Moderate River Flooding | ||
| Dhaka | Dhaka | Dohar | A | 7.99 | 9 | 19651 | 2,459 | 55.9 | 3889 | 23.9 | 79 | Severe river Flooding | Beside Padma | |
| Dhaka | Faridpur | Faridpur | A | 19.07 | 9 | 122425 | 6,189 | 77.1 | 27574 | 38.3 | 36 | Moderate river Flooding | ||
| Rangpur | Gaibandha | Gaibandha | A | 3.39 | 9 | 21200 | 6,254 | 71.5 | 4967 | 44.8 | 16 | Moderate river Flooding | ||
| Dhaka | Gopalganj | Tungipara | A | 4.85 | 9 | 18663 | 3,848 | 58.5 | 4156 | 42.6 | 25 | Moderate river Flooding | ||
| Sylhet | Habiganj | Nabiganj | A | 9.37 | 9 | 34015 | 3,630 | 68.9 | 6416 | 26.8 | 70 | Moderate Flash Flooding | ||
| Sylhet | Habiganj | Habiganj | A | 8.97 | 9 | 69512 | 7,749 | 71.3 | 13517 | 16.9 | 89 | |||
| Mymensingh | Jamalpur | Jamalpur | A | 53.28 | 12 | 142764 | 2,718 | 62.1 | 35619 | 49.8 | 9 | Moderate river Flooding | Beside old Brahmaputra | |
| Mymensingh | Jamalpur | Melandaha | A | 19.25 | 9 | 16569 | 861 | 44.4 | 3997 | 47.2 | 12 | Moderate river Flooding | ||
| Khulna | Khulna | Paikgachha | A | 27.78 | 9 | 41608 | 1,498 | 55.3 | 8815 | 42.4 | 27 | Moderate river Flooding | ||
| Dhaka | Kishoreganj | Bhairab | A | 10.5 | 9 | 21914 | 2,087 | 63.6 | 5276 | 33.9 | 48 | Moderate river Flooding | Beside Meghna | |
| Rangpur | Kurigram | Nageswari | A | 13.32 | 9 | 102988 | 7,732 | 74.8 | 23037 | 65.0 | 1 | Moderate river Flooding | Beside Kaljani & Brahmaputra | |
| Rangpur | Kurigram | Kurigram | A | 27.04 | 9 | 77252 | 2,857 | 63.2 | 17159 | 58.0 | 3 | Moderate river Flooding | Beside Dharla | |
| Khulna | Kushtia | Kushtia | A | 6.53 | 9 | 20522 | 3,143 | 60.3 | 4218 | 3.0 | 99 | Moderate river Flooding | Beside Gorai | |
| Dhaka | Madaripur | Shibchar | A | 43.92 | 9 | 98355 | 2,239 | 65.9 | 22105 | 38.8 | 34 | Moderate river Flooding | Close to Padma | |
| Dhaka | Madaripur | Madaripur | A | 7.7 | 9 | 21930 | 2,848 | 50.2 | 4077 | 35.0 | 45 | Moderate river Flooding | ||
| Dhaka | Munshiganj | Munshiganj | A | 12.95 | 9 | 31,320 | 2,418.53 | 45.7 | 7615 | 30.8 | 59 | Moderate river Flooding | ||
| Dhaka | Narsingdi | Narsingdi | A | 14.75 | 9 | 185128 | 40,661 | 64.4 | 8837 | 22.8 | 82 | |||
| Rajshahi | Natore | Singra | A | 29.39 | 33192 | 1,129 | 56.8 | 7955 | 37.8 | 38 | ||||
| Mymensingh | Netrokona | Mohanganj | A | 6.97 | 27193 | 3,901 | 65.8 | 5786 | 34.3 | 47 | Moderate river & flash Flooding | |||
| Rajshahi | Pabna | Bera | A | 14.14 | 9 | 53157 | 3,759 | 51.2 | 10539 | 39.4 | 32 | Moderate river Flooding | Beside Gumani and Brahmaputra | |
| Rajshahi | Pabna | Santhia | A | 42 | 9 | 62289 | 1,483 | 49.7 | 15298 | 33.1 | 53 | Moderate river Flooding | ||
| Barishal | Patuakhali | Kalapara | A | 9.95 | 9 | 55323 | 5,560 | 64.3 | 10613 | 20.3 | 84 | Severe tidal flooding | Tidal Flooding | |
| Barishal | Pirojpur | Mathbaria | A | 29.41 | 9 | 27700 | 942 | 53.8 | 6541 | 38.0 | 37 | Severe tidal flooding | ||
| Dhaka | Rajbari | Rajbari | A | 32.39 | 9 | 113322 | 3,499 | 69.3 | 26896 | 38.7 | 35 | Moderate tidal surge | ||
| Rajshahi | Rajshahi | Charghat | A | 10.23 | 9 | 27335 | 2,672 | 62.6 | 7128 | 31.4 | 55 | Severe river Flooding | Bank of Padma | |
| Chattogram | Rangamati | Rangamati | A | 64.75 | 84000 | 1,297 | 73.1 | 18355 | 7.3 | 97 | ||||
| Dhaka | Shariatpur | Shariatpur | A | 24.92 | 49535 | 1,988 | 62.5 | 10908 | 49.8 | 8 | Moderate river Flooding | Beside Padma | ||
| Dhaka | Shariatpur | Damuddya | A | 8.02 | 9 | 24154 | 3,012 | 65.9 | 5527 | 47.9 | 11 | Moderate river Flooding | Beside Padma | |
| Rajshahi | Sirajganj | Shahjadpur | A | 11.07 | 9 | 64507 | 5,827 | 56.1 | 14226 | 41.8 | 29 | Moderate river Flooding | Beside Padma, | |
| Rajshahi | Rajshahi | Godagari | A | 11.07 | 9 | 64507 | 5,827 | 56.1 | 14226 | 44.1 | 19 | Moderate river Flooding | ||
| Rajshahi | Sirajganj | Ullapara | A | 12.07 | 47693 | 3,951 | 61.9 | 10526 | 36.6 | 43 | ||||
| Sylhet | Sunamganj | Chhatak | A | 17.31 | 9 | 65332 | 3,774 | 60.5 | 11926 | 23.6 | 80 | Severe Flash Flooding | Beside Surma river | |
| Sylhet | Sylhet | Golapganj | A | 4.98 | 9 | 20019 | 4,020 | 79.3 | 3985 | 14.9 | 90 | Moderate river Flooding | Beside Surma river | |
| Table 10: Selected 61 A- type overall ( Moderate 41 | |||||||||||||
| SL | District | Pourashava | A-Type Pourashava | Area (sq. km.) | Ward | Population (Both sex) | Population Density | Literacy Rate(7+years) | Household | Poverty headcount ratio (%) | Poverty Rank 1 >= high to large number as low | Multi Hazard | Proximity to climatic hotspot(River, Sea and others) |
| Bagerhat | Mongla | A | 11.85 | 9 | 17311 | 1,461 | 68.7 | 4067 | 41.9 | 28 | Moderate tidal Flooding | ||
| Barguna | Amtali | A | 6.22 | 9 | 15418 | 2,479 | 76.7 | 3395 | 22.8 | 83 | Severe tidal flooding | Beside Payra River | |
| Barguna | Barguna | A | 15.57 | 9 | 32235 | 2,070 | 75.9 | 7353 | 19.2 | 86 | Severe tidal flooding | Between Payra & BishKhali River | |
| Barishal | Muladi | A | 16.96 | 9 | 20490 | 1,208 | 62.6 | 4528 | 58.2 | 2 | |||
| Brahmanbaria | Akhaura | A | 16.42 | 9 | 50068 | 3,049 | 52.2 | 11012 | 26.9 | 69 | Moderate river Flooding | Beside Titas riiver | |
| Brahmanbaria | Nabinagar | A | 12.43 | 9 | 34148 | 2,747 | 61.5 | 7505 | 30.5 | 60 | Moderate river Flooding | Beside Meghna | |
| Brahmanbaria | Brahmanbaria | A | 15.71 | 9 | 118992 | 7,574 | 53.6 | 24057 | 26.0 | 71 | Moderate river Flooding | ||
| Chandpur | Matlab | A | 13.42 | 9 | 27595 | 2,056 | 54.6 | 6016 | 51.5 | 5 | Moderate river Flooding | ||
| Chandpur | Chengarchar | A | 22.66 | 9 | 47477 | 2,095 | 76 | 9635 | 49.9 | 7 | Severe river Flooding | Beside Meghna | |
| Chandpur | Chandpur | A | 5.13 | 9 | 20606 | 4,017 | 56.6 | 4712 | 45.5 | 15 | Severe river Flooding | Beside Meghna | |
| Cox’s Bazar | Chakoria | A | 27.23 | 9 | 36691 | 7,884 | 59.2 | 7884 | 28.5 | 62 | Moderate river Flooding | ||
| Cumilla | Chouddagram | A | 11.98 | 9 | 44364 | 3,703 | 55.6 | 7824 | 34.4 | 46 | Moderate River Flooding | ||
| Dhaka | Dohar | A | 7.99 | 9 | 19651 | 2,459 | 55.9 | 3889 | 23.9 | 79 | Severe river Flooding | Beside Padma | |
| Faridpur | Faridpur | A | 19.07 | 9 | 122425 | 6,189 | 77.1 | 27574 | 38.3 | 36 | Moderate river Flooding | ||
| Gaibandha | Gaibandha | A | 3.39 | 9 | 21200 | 6,254 | 71.5 | 4967 | 44.8 | 16 | Moderate river Flooding | ||
| Gopalganj | Tungipara | A | 4.85 | 9 | 18663 | 3,848 | 58.5 | 4156 | 42.6 | 25 | Moderate river Flooding | ||
| Habiganj | Chunarughat | A | 16.5 | 9 | 32444 | 1,966 | 62.2 | 5652 | 27.5 | 68 | Moderate to severe flash flooding | Beside Khoi nRiver( from india) | |
| Habiganj | Nabiganj | A | 9.37 | 9 | 34015 | 3,630 | 68.9 | 6416 | 26.8 | 70 | Moderate Flash Flooding | ||
| Habiganj | Habiganj | A | 8.97 | 9 | 69512 | 7,749 | 71.3 | 13517 | 16.9 | 89 | |||
| Jamalpur | Jamalpur | A | 53.28 | 12 | 142764 | 2,718 | 62.1 | 35619 | 49.8 | 9 | Moderate river Flooding | Beside old Brahmaputra | |
| Jamalpur | Melandaha | A | 19.25 | 9 | 16569 | 861 | 44.4 | 3997 | 47.2 | 12 | Moderate river Flooding | ||
| Khagrchhari | Khagrachhari | A | 13.05 | 9 | 47278 | 3,623 | 71 | 10247 | 19.5 | 85 | |||
| Khulna | Paikgachha | A | 27.78 | 9 | 41608 | 1,498 | 55.3 | 8815 | 42.4 | 27 | Moderate river Flooding | ||
| Kishoreganj | Bhairab | A | 10.5 | 9 | 21914 | 2,087 | 63.6 | 5276 | 33.9 | 48 | Moderate river Flooding | Beside Meghna | |
| Kurigram | Nageswari | A | 13.32 | 9 | 102988 | 7,732 | 74.8 | 23037 | 65.0 | 1 | Moderate river Flooding | Beside Kaljani & Brahmaputra | |
| Kurigram | Kurigram | A | 27.04 | 9 | 77252 | 2,857 | 63.2 | 17159 | 58.0 | 3 | Moderate river Flooding | Beside Dharla | |
| Kushtia | Kushtia | A | 6.53 | 9 | 20522 | 3,143 | 60.3 | 4218 | 3.0 | 99 | Moderate river Flooding | Beside Gorai | |
| Madaripur | Kalkini | A | 14.22 | 9 | 62690 | 4,409 | 73.1 | 14112 | 33.2 | 52 | Moderate river Flooding | ||
| Madaripur | Shibchar | A | 43.92 | 9 | 98355 | 2,239 | 65.9 | 22105 | 38.8 | 34 | Moderate river Flooding | Close to Padma | |
| Madaripur | Madaripur | A | 7.7 | 9 | 21930 | 2,848 | 50.2 | 4077 | 35.0 | 45 | Moderate river Flooding | ||
| Munshiganj | Mirkadim | A | 30.92 | 9 | 59286 | 1,917 | 63 | 13682 | 30.8 | 58 | Moderate river Flooding | ||
| Munshiganj | Munshiganj | A | 12.95 | 9 | 31,320 | 2,418.53 | 45.7 | 7615 | 30.8 | 59 | Moderate river Flooding | ||
| Mymensingh | Gafargaon | A | 5.39 | 9 | 29325 | 5,441 | 67.7 | 6513 | 43.9 | 21 | Moderate river Flooding | Beside old Brahmaputra | |
| Narsingdi | Narsingdi | A | 14.75 | 9 | 185128 | 40,661 | 64.4 | 8837 | 22.8 | 82 | |||
| Natore | Singra | A | 29.39 | 33192 | 1,129 | 56.8 | 7955 | 37.8 | 38 | ||||
| Netrokona | Mohanganj | A | 6.97 | 27193 | 3,901 | 65.8 | 5786 | 34.3 | 47 | Moderate river & flash Flooding | |||
| Pabna | Bera | A | 14.14 | 9 | 53157 | 3,759 | 51.2 | 10539 | 39.4 | 32 | Moderate river Flooding | Beside Gumani and Brahmaputra | |
| Pabna | Sujanagar | A | 26.9 | 9 | 42299 | 1,572 | 81.7 | 9945 | 35.4 | 44 | Severe river Flooding | Beside Padma, Severe flood prone | |
| Pabna | Santhia | A | 42 | 9 | 62289 | 1,483 | 49.7 | 15298 | 33.1 | 53 | Moderate river Flooding | ||
| Panchagarh | Panchagarh | A | 5.53 | 9 | 16017 | 2,896 | 65.9 | 3788 | 24.2 | 77 | Moderate Flash Flooding | Beside Korotoa River and Talma in ease side | |
| Patuakhali | Galachipa | A | 12.57 | 9 | 29098 | 2,315 | 67.7 | 6569 | 26.0 | 73 | Severe tidal flooding | Beside Galachipa | |
| Patuakhali | Kalapara | A | 9.95 | 9 | 55323 | 5,560 | 64.3 | 10613 | 20.3 | 84 | Severe tidal flooding | Tidal Flooding | |
| Pirojpur | Mathbaria | A | 29.41 | 9 | 27700 | 942 | 53.8 | 6541 | 38.0 | 37 | Severe tidal flooding | ||
| Rajbari | Goalanda | A | 27.15 | 9 | 59148 | 2,179 | 63.3 | 11460 | 50.5 | 6 | Severe river Flooding | ||
| Rajbari | Pangsha | A | 26.29 | 9 | 38704 | 1,472 | 47.9 | 9319 | 45.7 | 14 | Moderate river Flooding | Beside Padma | |
| Rajbari | Rajbari | A | 32.39 | 9 | 113322 | 3,499 | 69.3 | 26896 | 38.7 | 35 | Moderate tidal surge | ||
| Rajshahi | Kakonhat | A | 24.92 | 9 | 49535 | 1,988 | 62.5 | 10908 | 44.1 | 20 | Severe Dorught Prone | Severe Dorught Prone | |
| Rajshahi | Bagha | A | 11.69 | 27623 | 2,363 | 55.4 | 7044 | 33.6 | 49 | ||||
| Rajshahi | Charghat | A | 10.23 | 9 | 27335 | 2,672 | 62.6 | 7128 | 31.4 | 55 | Severe river Flooding | Bank of Padma | |
| Rangamati | Rangamati | A | 64.75 | 84000 | 1,297 | 73.1 | 18355 | 7.3 | 97 | ||||
| Satkhira | Satkhira | A | 6.35 | 9 | 23314 | 3,671 | 57.5 | 4513 | 43.1 | 23 | Moderate Tidal Flooding | SLR, Tidal Floods, Salinity | |
| Shariatpur | Shariatpur | A | 24.92 | 49535 | 1,988 | 62.5 | 10908 | 49.8 | 8 | Moderate river Flooding | Beside Padma | ||
| Shariatpur | Damuddya | A | 8.02 | 9 | 24154 | 3,012 | 65.9 | 5527 | 47.9 | 11 | Moderate river Flooding | Beside Padma | |
| Sirajganj | Belkuchi | A | 28.49 | 9 | 158913 | 5,578 | 63.2 | 35556 | 42.5 | 26 | Severe River Flooding | Beside Brahmaputra River | |
| Sirajganj | Shahjadpur | A | 11.07 | 9 | 64507 | 5,827 | 56.1 | 14226 | 41.8 | 29 | Moderate river Flooding | Beside Padma, | |
| Rajshahi | Godagari | A | 11.07 | 9 | 64507 | 5,827 | 56.1 | 14226 | 44.1 | 19 | Beside padma | Moderate river Flooding | |
| Sirajganj | Sirajganj | A | 5.33 | 9 | 19866 | 3,727 | 62.8 | 3784 | 36.7 | 42 | Severe river Flooding | Beside Brahmaputra River | |
| Sirajganj | Ullapara | A | 12.07 | 47693 | 3,951 | 61.9 | 10526 | 36.6 | 43 | ||||
| Sunamganj | Sunamganj | A | 11.08 | 9 | 25461 | 2,298 | 44.6 | 5833 | 25.1 | 76 | Severe Flash Flooding | Confluence of Surma and Wahumgi river | |
| Sunamganj | Chhatak | A | 17.31 | 9 | 65332 | 3,774 | 60.5 | 11926 | 23.6 | 80 | Severe Flash Flooding | Beside Surma river | |
| Sylhet | Golapganj | A | 4.98 | 9 | 20019 | 4,020 | 79.3 | 3985 | 14.9 | 90 | Moderate river Flooding | Beside Surma river | |
4.3. Vulnerability analysis with other variables ( HIES 2011, NCVA, Literacy, WB Poverty, general employment )
4.3.1 Analysis of vulnerability in terms of exposure of heat stress in the future ( 2070-2099) : A-type Municipality superimposed over the GIZ NCVA map (nationwide climate vulnerability assessment in Bangladesh)
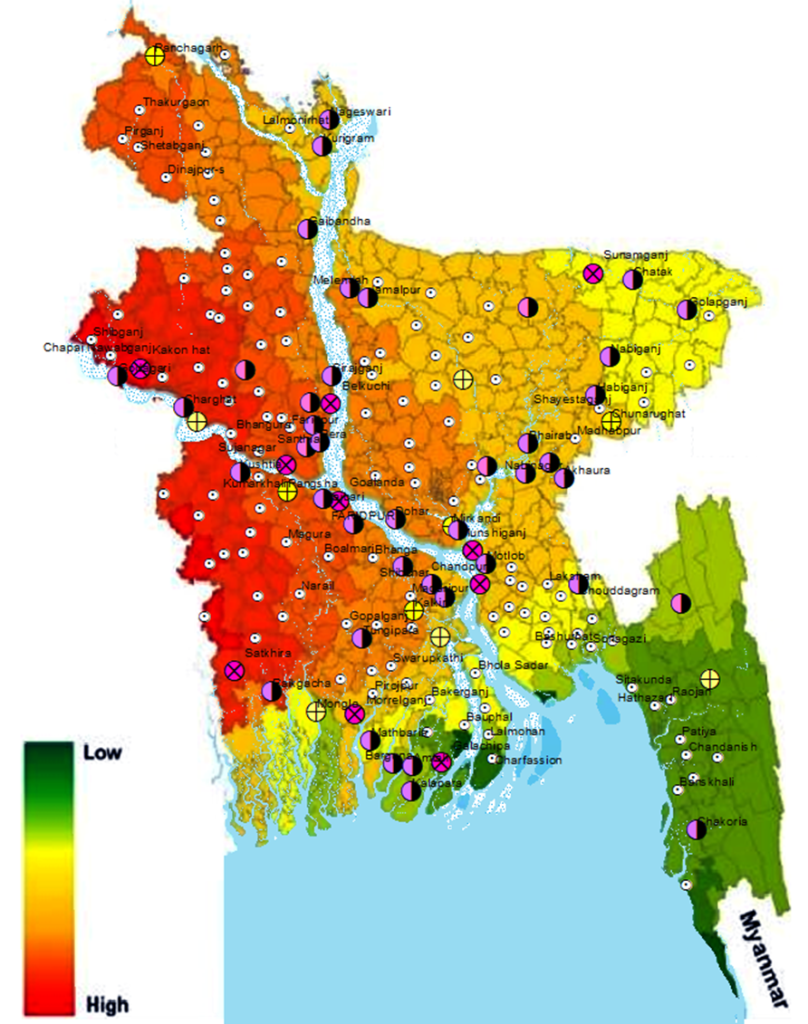
Figure 10: Map heat stress , Data source : Map ofGIZ NCVA map (nationwide climate vulnerability assessment in Bangladesh) , Dec 2018( Prepared by Z M Sajjadul Islam )
4.3.2 Poverty analysis with World Bank head count poverty data ( Upazila wise)
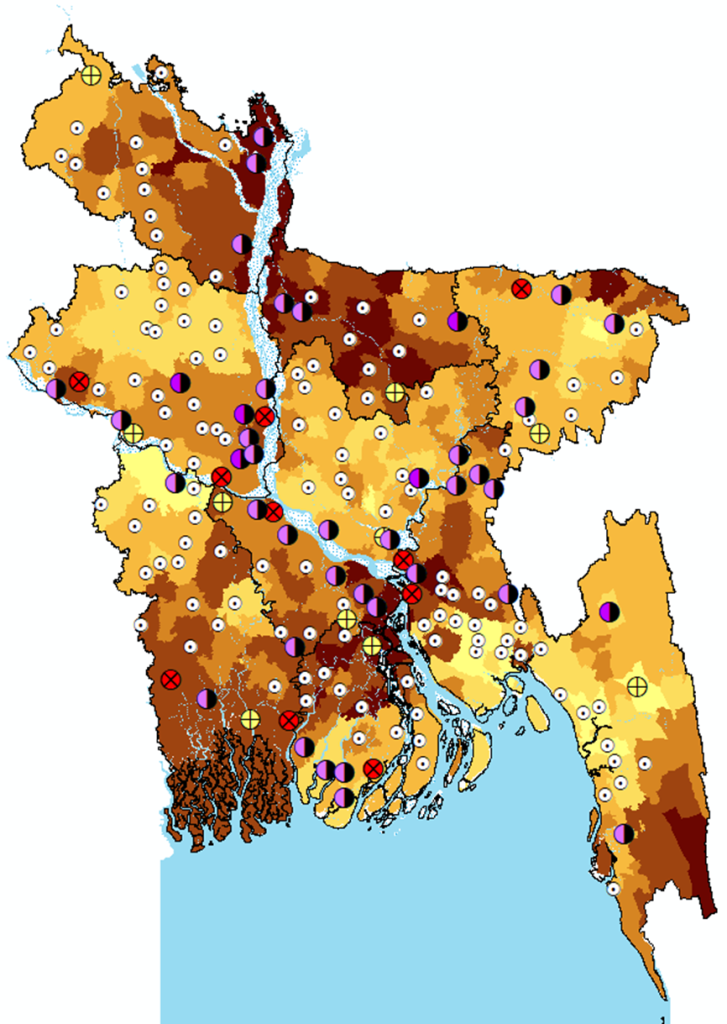
Figure 11: Map Poverty
Data Source : Head county poverty data of World Bank ( published in World Bank website in November 10, 2016 )
4.3.3 Primary employment on service :- Vulnerable Municipality normalized by Primary employment at service sector( Upazila wise) of World Bank Data on Primary employment on service :
Figure 11: Map Poverty , Data Source : Head county poverty data of World Bank ( published in World Bank website in November 10, 2016 ), Prepared by Z M Sajjadul Islam
4.3.3 Primary employment on service :- Vulnerable Municipality normalized by Primary employment at service sector( Upazila wise) of World Bank Data on Primary employment on service :
Figure 12: Employment Status , Source : Primary employment on service data of World Bank ( published in World Bank website in November 10, 2016 ), Prepared by Z M Sajjadul Islam
4.3.4 Municipality wise Literacy rate :- Vulnerable Municipality normalized by literacy rate (both sex)
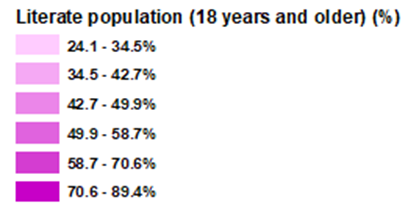
Prepared by Z M Sajjadul Islam
5.0 Selection of vulnerable District Council:
5.1 District wise ratio of poverty ( District wise head count ratio of World Bank)
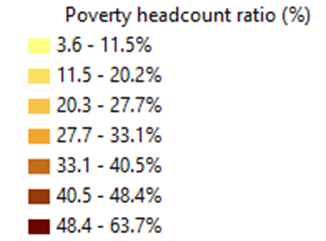
Figure 13: District poverty map, Source : District wise head count ratio of World Bank ( published in World Bank website in November 10, 2016 )Prepared by Z M Sajjadul Islam ,
5.2 District Poverty ranking and selection ( Source : District wise poverty head count ratio which published in World Bank website in November 10, 2016 )
Barisal Division :
| Division Name | Zila Name | Poverty headcount ratio (%) | Rank (Poorest to Richest ) | In the middle of raking : Poor & Rich Districts |
| BARISAL | BARISAL | 54.8 | 1 | |
| BARISAL | PIROJPUR | 44.1 | 2 | Poorer District |
| BARISAL | JHALOKATI | 40.5 | 3 | Middle point of the rank |
| BARISAL | BHOLA | 33.2 | 4 | |
| BARISAL | PATUAKHALI | 25.8 | 5 | Richer District |
| BARISAL | BARGUNA | 19.0 | 6 |
Chittagong Division :
| Division Name | Zila Name | Poverty headcount ratio (%) | Rank (Poorest to Richest ) | In the middle of raking : Poor & Rich Districts |
| CHITTAGONG | CHANDPUR | 51.0 | 1 | |
| CHITTAGONG | BANDARBAN | 40.1 | 2 | |
| CHITTAGONG | COMILLA | 37.9 | 3 | Poorer District |
| CHITTAGONG | COX’S BAZAR | 32.7 | 4 | |
| CHITTAGONG | LAKSHMIPUR | 31.2 | 5 | |
| CHITTAGONG | BRAHMANBARIA | 30.0 | 6 | Middle point of the rank |
| CHITTAGONG | FENI | 25.9 | 7 | |
| CHITTAGONG | KHAGRACHHARI | 25.5 | 8 | |
| CHITTAGONG | RANGAMATI | 20.3 | 9 | Richer District |
| CHITTAGONG | CHITTAGONG | 11.5 | 10 | |
| CHITTAGONG | NOAKHALI | 9.6 | 11 |
Dhaka Division :
| Division Name | Zila Name | Poverty headcount ratio (%) | Rank (Poorest to Richest ) | In the middle of raking : Poor & Rich Districts |
| DHAKA | SHARIATPUR | 52.6 | 1 | |
| DHAKA | GOPALGANJ | 42.7 | 2 | |
| DHAKA | RAJBARI | 41.9 | 3 | Poorer District |
| DHAKA | FARIDPUR | 36.3 | 4 | |
| DHAKA | MADARIPUR | 34.9 | 5 | |
| DHAKA | KISHOREGANJ | 30.3 | 6 | |
| DHAKA | TANGAIL | 29.7 | 7 | Middle point of the rank |
| DHAKA | MUNSHIGANJ | 28.7 | 8 | |
| DHAKA | NARAYANGANJ | 26.1 | 9 | |
| DHAKA | NARSINGDI | 23.7 | 10 | |
| DHAKA | GAZIPUR | 19.4 | 11 | Richer District |
| DHAKA | MANIKGANJ | 18.5 | 12 | |
| DHAKA | DHAKA | 15.7 | 13 |
Mymensingh Division :
| Division Name | Zila Name | Poverty headcount ratio (%) | Rank (Poorest to Richest ) | In the middle of raking : Poor & Rich Districts |
| MYMENSINGH | JAMALPUR | 51.1 | 1 | |
| MYMENSINGH | MYMENSINGH | 50.5 | 2 | Poorer District |
| Middle point of the rank | ||||
| MYMENSINGH | SHERPUR | 48.4 | 3 | Richer District |
| MYMENSINGH | NETRAKONA | 35.3 | 4 | |
Khulna Division :
| Division Name | Zila Name | Poverty headcount ratio (%) | Rank (Poorest to Richest ) | In the middle of raking : Poor & Rich Districts |
| KHULNA | SATKHIRA | 46.3 | 1 | |
| KHULNA | MAGURA | 45.4 | 2 | |
| KHULNA | BAGERHAT | 42.8 | 3 | Poorer District |
| KHULNA | JESSORE | 39.0 | 4 | |
| KHULNA | KHULNA | 38.8 | 5 | Middle point of the rank |
| KHULNA | CHUADANGA | 27.7 | 6 | |
| KHULNA | JHENAIDAH | 24.7 | 7 | |
| KHULNA | NARAIL | 20.0 | 8 | Richer District |
| KHULNA | MEHERPUR | 15.2 | 9 | |
| KHULNA | KUSHTIA | 3.6 | 10 |
Rajshahi Division :
Division Name | Zila Name | Poverty headcount ratio (%) | Rank (Poorest to Richest ) | In the middle of raking : Poor & Rich Districts |
| RAJSHAHI | SIRAJGANJ | 38.7 | 1 | |
| RAJSHAHI | NATORE | 35.1 | 2 | Poorer District |
| RAJSHAHI | PABNA | 31.5 | 3 | |
| RAJSHAHI | RAJSHAHI | 31.4 | 4 | |
| RAJSHAHI | JOYPURHAT | 26.7 | 5 | Middle point of the rank |
| RAJSHAHI | CHAPAI NABABGANJ | 25.3 | 6 | |
| RAJSHAHI | NAOGAON | 16.9 | 7 | Richer District |
| RAJSHAHI | BOGRA | 16.6 | 8 |
Rangpur Division :
Division Name | Zila Name | Poverty headcount ratio (%) | Rank (Poorest to Richest ) | In the middle of raking : Poor & Rich Districts |
| RANGPUR | KURIGRAM | 63.7 | 1 | |
| RANGPUR | GAIBANDHA | 48.0 | 2 | Poorer District |
| RANGPUR | RANGPUR | 46.2 | 3 | |
| RANGPUR | DINAJPUR | 37.9 | 4 | Middle point of the rank |
| RANGPUR | NILPHAMARI | 34.8 | 5 | |
| RANGPUR | LALMONIRHAT | 34.5 | 6 | |
| RANGPUR | THAKURGAON | 27.0 | 7 | Richer District |
| RANGPUR | PANCHAGARH | 26.7 | 8 |
Sylhet Division :
| Division Name | Zila Name | Poverty headcount ratio (%) | Rank (Poorest to Richest ) | In the middle of raking : Poor & Rich Districts |
| SYLHET | SUNAMGANJ | 26.0 | 1 | |
| SYLHET | MAULVIBAZAR | 25.7 | 2 | Poorer District |
| Middle point of the rank | ||||
| SYLHET | HABIGANJ | 25.3 | 3 | Richer District |
| SYLHET | SYLHET | 24.1 | 4 |
Source :World Bank https://www.worldbank.org/en/data/interactive/2016/11/10/bangladesh-poverty-maps
5.3 Selection of 16 District Councils from rank
Table 11 : vulnerable district councils
| SL | Division Name | Zila Name | Poverty headcount ratio (%) | Rank ( Poor > 1(higher %) to rich 64) ( Lower %) | In the middle of raking : Poor & Rich Districts |
| BARISAL | PIROJPUR | 44.1 | 12 | Poorer District | |
| BARISAL | PATUAKHALI | 25.8 | 45 | Richer District | |
| CHITTAGONG | COMILLA | 32.7 | 21 | Poorer District | |
| CHITTAGONG | RANGAMATI | 20.3 | 53 | Richer District | |
| DHAKA | RAJBARI | 41.9 | 15 | Poorer District | |
| DHAKA | GAZIPUR | 26.1 | 55 | Richer District | |
| MYMENSINGH | MYMENSINGH | 50.5 | 6 | Poorer District | |
| MYMENSINGH | SHERPUR | 48.4 | 7 | Richer District | |
| KHULNA | BAGERHAT | 42.8 | 13 | Poorer District | |
| KHULNA | NARAIL | 24.7 | 54 | Richer District | |
| RAJSHAHI | NATORE | 31.5 | 25 | Poorer District | |
| RAJSHAHI | NAOGAON | 25.3 | 58 | Richer District | |
| RANGPUR | GAIBANDHA | 46.2 | 8 | Poorer District | |
| RANGPUR | THAKURGAON | 34.5 | 39 | Richer District | |
| SYLHET | MAULVIBAZAR | 25.7 | 46 | Poorer District | |
| SYLHET | HABIGANJ | 25.3 | 49 | Richer District |
Table 12 : All District with poverty rank
| SL | Division Name | Zila Name | Poverty headcount ratio (%) | Rank ( Poor > 1(higher %) to rich 64) ( Lower %) |
| 1. | BARISAL | BARISAL | 54.8 | 2 |
| 2. | BARISAL | PIROJPUR | 44.1 | 12 |
| 3. | BARISAL | JHALOKATI | 40.5 | 16 |
| 4. | BARISAL | BHOLA | 33.2 | 29 |
| 5. | BARISAL | PATUAKHALI | 25.8 | 45 |
| 6. | BARISAL | BARGUNA | 19 | 56 |
| 7. | CHITTAGONG | CHANDPUR | 51 | 5 |
| 8. | CHITTAGONG | BANDARBAN | 40.1 | 17 |
| 9. | CHITTAGONG | COMILLA | 37.9 | 21 |
| 10. | CHITTAGONG | COX’S BAZAR | 32.7 | 30 |
| 11. | CHITTAGONG | LAKSHMIPUR | 31.2 | 33 |
| 12. | CHITTAGONG | BRAHMANBARIA | 30 | 35 |
| 13. | CHITTAGONG | FENI | 25.9 | 44 |
| 14. | CHITTAGONG | KHAGRACHHARI | 25.5 | 47 |
| 15. | CHITTAGONG | RANGAMATI | 20.3 | 53 |
| 16. | CHITTAGONG | CHITTAGONG | 11.5 | 62 |
| 17. | CHITTAGONG | NOAKHALI | 9.6 | 63 |
| 18. | DHAKA | SHARIATPUR | 52.6 | 3 |
| 19. | DHAKA | GOPALGANJ | 42.7 | 14 |
| 20. | DHAKA | RAJBARI | 41.9 | 15 |
| 21. | DHAKA | FARIDPUR | 36.3 | 23 |
| 22. | DHAKA | MADARIPUR | 34.9 | 26 |
| 23. | DHAKA | KISHOREGANJ | 30.3 | 34 |
| 24. | DHAKA | TANGAIL | 29.7 | 36 |
| 25. | DHAKA | MUNSHIGANJ | 28.7 | 37 |
| 26. | DHAKA | NARAYANGANJ | 26.1 | 42 |
| 27. | DHAKA | NARSINGDI | 23.7 | 52 |
| 28. | DHAKA | GAZIPUR | 19.4 | 55 |
| 29. | DHAKA | MANIKGANJ | 18.5 | 57 |
| 30. | DHAKA | DHAKA | 15.7 | 60 |
| 31. | KHULNA | SATKHIRA | 46.3 | 9 |
| 32. | KHULNA | MAGURA | 45.4 | 11 |
| 33. | KHULNA | BAGERHAT | 42.8 | 13 |
| 34. | KHULNA | JESSORE | 39 | 18 |
| 35. | KHULNA | KHULNA | 38.8 | 19 |
| 36. | KHULNA | CHUADANGA | 27.7 | 38 |
| 37. | KHULNA | JHENAIDAH | 24.7 | 50 |
| 38. | KHULNA | NARAIL | 20 | 54 |
| 39. | KHULNA | MEHERPUR | 15.2 | 61 |
| 40. | KHULNA | KUSHTIA | 3.6 | 64 |
| 41. | MYMENSINGH | JAMALPUR | 51.1 | 4 |
| 42. | MYMENSINGH | MYMENSINGH | 50.5 | 6 |
| 43. | MYMENSINGH | SHERPUR | 48.4 | 7 |
| 44. | MYMENSINGH | NETRAKONA | 35.3 | 24 |
| 45. | RAJSHAHI | SIRAJGANJ | 38.7 | 20 |
| 46. | RAJSHAHI | NATORE | 35.1 | 25 |
| 47. | RAJSHAHI | PABNA | 31.5 | 31 |
| 48. | RAJSHAHI | RAJSHAHI | 31.4 | 32 |
| 49. | RAJSHAHI | JOYPURHAT | 26.7 | 40 |
| 50. | RAJSHAHI | CHAPAI NABABGANJ | 25.3 | 48 |
| 51. | RAJSHAHI | NAOGAON | 16.9 | 58 |
| 52. | RAJSHAHI | BOGRA | 16.6 | 59 |
| 53. | RANGPUR | KURIGRAM | 63.7 | 1 |
| 54. | RANGPUR | GAIBANDHA | 48 | 8 |
| 55. | RANGPUR | RANGPUR | 46.2 | 10 |
| 56. | RANGPUR | DINAJPUR | 37.9 | 22 |
| 57. | RANGPUR | NILPHAMARI | 34.8 | 27 |
| 58. | RANGPUR | LALMONIRHAT | 34.5 | 28 |
| 59. | RANGPUR | THAKURGAON | 27 | 39 |
| 60. | RANGPUR | PANCHAGARH | 26.7 | 41 |
| 61. | SYLHET | SUNAMGANJ | 26 | 43 |
| 62. | SYLHET | MAULVIBAZAR | 25.7 | 46 |
| 63. | SYLHET | HABIGANJ | 25.3 | 49 |
| 64. | SYLHET | SYLHET | 24.1 | 51 |
Source : District wise poverty head count ratio which published in World Bank website in November 10, 2016
5.4 GIS Maps on selected 16 District Councils from rank (poorer & richer) from Divisions
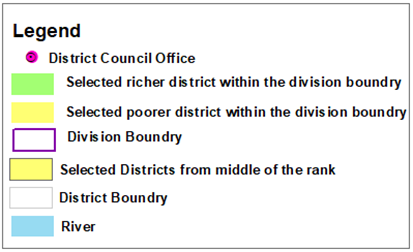
Figure 14: Selected District council on map, Prepared by Z M Sajjadul Islam ,
Table 12 : Total 183 A-Type Municipality/Pourashava of Bangladesh : Data source : BBS HIES 2011, National Report-Vol 3, Urban area report in August 2014
| SL | Division | District | Pourashava | A-Type Pourashava | Area (sq. km.) | Ward | Population (Both sex) | Population Density | Literacy Rate(7+years) | Household | Multi Hazard |
| 1 | Khulna | Bagerhat | Morrelganj | A | 6 | 9 | 21741 | 3,624 | 73.8 | 5070 | Severe tidal flooding |
| 2 | Khulna | Bagerhat | Bagerhat | A | 7.53 | 9 | 49073 | 6,517 | 75.8 | 11982 | Low river flooding |
| 3 | Khulna | Bagerhat | Mongla | A | 19.4 | 9 | 39837 | 2,053 | 64.1 | 8927 | Moderate tidal surge |
| 4 | Chattogram | Bandarban | Bandarban | A | 13.05 | 9 | 41434 | 3,175 | 67.1 | 8699 | Not Flood prone |
| 5 | Barishal | Barguna | Amtali | A | 11.85 | 9 | 17311 | 1,461 | 68.7 | 4067 | Severe tidal surge |
| 6 | Barishal | Barguna | Barguna | A | 15.57 | 9 | 32235 | 2,070 | 75.9 | 7353 | Severe tidal surge |
| 7 | Barishal | Barishal | Bakerganj | A | 6.22 | 9 | 15418 | 2,479 | 76.7 | 3395 | Moderate tidal surge |
| 8 | Barishal | Barishal | Gouranadi | A | 16.83 | 9 | 42438 | 2,522 | 68.9 | 9417 | Not Flood prone |
| 9 | Barishal | Barishal | Muladi | A | 16.96 | 9 | 20490 | 1,208 | 62.6 | 4528 | Low river flooding |
| 10 | Barishal | Bhola | Bhola | A | 22.66 | 9 | 47477 | 2,095 | 76 | 9635 | Moderate tidal surge |
| 11 | Barishal | Bhola | Burhanuddin | A | 3.22 | 9 | 13110 | 4,071 | 69 | 2649 | Moderate tidal surge |
| 12 | Barishal | Bhola | Charfassion | A | 9.49 | 9 | 19595 | 2,065 | 75.4 | 4088 | Moderate tidal surge |
| 13 | Barishal | Bhola | Lalmohan | A | 6.53 | 9 | 20522 | 3,143 | 60.3 | 4218 | Moderate tidal surge |
| 14 | Rajshahi | Bogura | Bogura | A | 68.63 | 21 | 400983 | 5,843 | 72.4 | 93351 | Not Flood prone |
| 15 | Rajshahi | Bogura | Dhupchanchia | A | 10.35 | 9 | 22406 | 2,165 | 61.6 | 5401 | Not Flood prone |
| 16 | Rajshahi | Bogura | Nandigram | A | 19.38 | 9 | 18496 | 954 | 56.3 | 4528 | Not Flood prone |
| 17 | Rajshahi | Bogura | Santahar | A | 10.2 | 9 | 31037 | 3,043 | 62.1 | 7847 | Not Flood prone |
| 18 | Rajshahi | Bogura | Sherpur | A | 7.7 | 9 | 25152 | 3,266 | 74.5 | 5678 | Low river flooding |
| 19 | Chattogram | Brahmanbaria | Akhaura | A | 17.6 | 9 | 172017 | 9,774 | 66 | 33517 | Moderate river Flooding |
| 20 | Chattogram | Brahmanbaria | Brahmanbaria | A | 22.49 | 12 | 193814 | 8,618 | 64.4 | 37329 | Moderate Flash Flooding |
| 21 | Chattogram | Brahmanbaria | Nabinagar | A | 14.14 | 9 | 53157 | 3,759 | 51.2 | 10539 | Moderate river Flooding |
| 22 | Chattogram | Chandpur | Chandpur | A | 22.91 | 15 | 159021 | 33,322 | 67.4 | 35813 | Severe river Flooding |
| 23 | Chattogram | Chandpur | Chengarchar | A | 27.23 | 9 | 36691 | 7,884 | 59.2 | 7884 | Severe river Flooding |
| 24 | Chattogram | Chandpur | Haziganj | A | 20.25 | 9 | 63892 | 3,155 | 66.2 | 12679 | Low river flooding |
| 25 | Chattogram | Chandpur | Kachua | A | 11.23 | 9 | 27024 | 2,406 | 63.3 | 5125 | Low river flooding |
| 26 | Chattogram | Chandpur | Matlab | A | 30.92 | 9 | 59286 | 1,917 | 63 | 13682 | Moderate river Flooding |
| 27 | Chattogram | Chandpur | Shahrasti | A | 15.65 | 9 | 28287 | 1,807 | 67 | 5815 | Low river flooding |
| 28 | Rajshahi | Chapai Nawabg | Chapai Nawabganj | A | 32.9 | 15 | 180731 | 39,422 | 60.8 | 39422 | Moderate river Flooding |
| 29 | Rajshahi | Chapai Nawabg | Rohanpur | A | 14.42 | 9 | 34941 | 2,423 | 56.5 | 7614 | Low river flooding |
| 30 | Rajshahi | Chapai Nawabg | Shibganj | A | 23.68 | 9 | 42693 | 1,803 | 51.9 | 9023 | Moderate river Flooding |
| 31 | Chattogram | Chattogram | Bariarhat | A | 2.12 | 9 | 11602 | 5,473 | 54 | 2354 | Severe tidal surge |
| 32 | Chattogram | Chattogram | Bashkhali | A | 28.42 | 9 | 36910 | 1,299 | 42.3 | 7378 | Moderate Flash Flooding |
| 33 | Chattogram | Chattogram | Chandanaish | A | 26.83 | 9 | 35248 | 1,314 | 61.4 | 6852 | Moderate Flash Flooding |
| 34 | Chattogram | Chattogram | Hathazari | A | 9.37 | 9 | 34015 | 3,630 | 68.9 | 6416 | Moderate Flash Flooding |
| 35 | Chattogram | Chattogram | Patiya | A | 9.95 | 9 | 55323 | 5,560 | 64.3 | 10613 | Moderate Flash Flooding |
| 36 | Chattogram | Chattogram | Raojan | A | 27.15 | 9 | 59148 | 2,179 | 63.3 | 11460 | Moderate Flash Flooding |
| 37 | Chattogram | Chattogram | Satkania | A | 12.51 | 9 | 45001 | 3,597 | 61.4 | 8548 | Not Flood prone |
| 38 | Chattogram | Chattogram | Sitakunda | A | 27.97 | 9 | 45147 | 1,614 | 62.1 | 9017 | Severe tidal surge |
| 39 | Khulna | Chuadanga | Alamdanga | A | 6 | 9 | 21741 | 3,624 | 73.8 | 5070 | Low river flooding |
| 40 | Khulna | Chuadanga | Chuadanga | A | 37.37 | 9 | 128865 | 1,867 | 57.4 | 30927 | Low river flooding |
| 41 | Chattogram | Cox’s Bazar | Chakoria | A | 15.76 | 9 | 72669 | 4,611 | 61.3 | 13163 | Severe Tidal Flooding |
| 42 | Chattogram | Cox’s Bazar | Cox’s Bazar | A | 7.94 | 12 | 223522 | 9,142 | 54.5 | 41517 | Not Flood prone |
| 43 | Chattogram | Cumilla | Chouddagram | A | 16.64 | 9 | 38317 | 2,303 | 63 | 7629 | Moderate river Flooding |
| 44 | Chattogram | Cumilla | Laksham | A | 19.86 | 9 | 70632 | 3,556 | 60.3 | 14079 | Moderate river Flooding |
| 45 | Chattogram | Cumilla | Nangalkot | A | 13.06 | 9 | 26719 | 2,046 | 52.6 | 5194 | Not Flood prone |
| 46 | Dhaka | Dhaka | Dhamrai | A | 6.98 | 9 | 56777 | 8,134 | 66.7 | 14380 | Low river flooding |
| 47 | Dhaka | Dhaka | Dohar | A | 11.28 | 9 | 17735 | 1,572 | 61.5 | 36434 | Severe river Flooding |
| 48 | Dhaka | Dhaka | Savar | A | 13.54 | 9 | 296851 | 21,924 | 74.9 | 75902 | Low river flooding |
| 49 | Rangpur | Dinajpur | Dinajpur | A | 20.67 | 12 | 191329 | 8,697 | 75 | 42034 | Low Flash Flooding |
| 50 | Rangpur | Dinajpur | Setabganj | A | 10.23 | 9 | 27335 | 2,672 | 62.6 | 7128 | Low Flash Flooding |
| 51 | Rangpur | Dinajpur | Birampur | A | 27.53 | 9 | 45334 | 1,647 | 59.7 | 10802 | Not Flood prone |
| 52 | Rangpur | Dinajpur | Fulbari | A | 16.04 | 9 | 34786 | 2,169 | 62.3 | 8170 | Not Flood prone |
| 53 | Rangpur | Dinajpur | Parbatipur | A | 6.67 | 9 | 29143 | 4,369 | 64.5 | 7299 | Not Flood prone |
| 54 | Dhaka | Faridpur | Bhanga | A | 12.43 | 9 | 34148 | 2,747 | 61.5 | 7505 | Moderate river Flooding |
| 55 | Dhaka | Faridpur | Boalmari | A | 13.42 | 9 | 27595 | 2,056 | 54.6 | 6016 | Moderate river Flooding |
| 56 | Dhaka | Faridpur | Faridpur | A | 19.07 | 9 | 122425 | 6,189 | 77.1 | 27574 | Moderate river Flooding |
| 57 | Chattogram | Feni | Sonagazi | A | 5.33 | 9 | 19866 | 3,727 | 62.8 | 3784 | Severe tidal flooding |
| 58 | Chattogram | Feni | Daganbhuiyan | A | 12.76 | 9 | 32080 | 2,514 | 65.1 | 6144 | Low river flooding |
| 59 | Chattogram | Feni | Feni | A | 22 | 18 | 156971 | 7,135 | 69.7 | 31468 | Not Flood prone |
| 60 | Rangpur | Gaibandha | Gaibandha | A | 11.29 | 9 | 67833 | 6,008 | 74.5 | 15430 | Moderate river flooding |
| 61 | Rangpur | Gaibandha | Gobindaganj | A | 14.47 | 9 | 38415 | 2,655 | 54.8 | 9718 | Low river flooding |
| 62 | Dhaka | Gazipur | Kaliakoir | A | 24.66 | 9 | 213061 | 6,019 | 69 | 43704 | Not Flood prone |
| 63 | Dhaka | Gazipur | Sreepur | A | 46.9 | 9 | 126249 | 2,692 | 63.3 | 31470 | Low river flooding |
| 64 | Dhaka | Gopalganj | Kotalipara | A | 2.05 | 9 | 5808 | 2,833 | 78 | 1240 | Not Flood prone |
| 65 | Dhaka | Gopalganj | Tungipara | A | 2.59 | 9 | 8596 | 3,319 | 63 | 1754 | Moderate river Flooding |
| 66 | Dhaka | Gopalganj | Gopalganj | A | 14.25 | 9 | 51346 | 3,603 | 78.6 | 11600 | Moderate river Flooding |
| 67 | Sylhet | Habiganj | Chunarughat | A | 7.99 | 9 | 19651 | 2,459 | 55.9 | 3889 | Severe Flash Flooding |
| 68 | Sylhet | Habiganj | Habiganj | A | 8.97 | 9 | 69512 | 7,749 | 71.3 | 13517 | Low Flash Flooding |
| 69 | Sylhet | Habiganj | Madhabpur | A | 7.7 | 9 | 21930 | 2,848 | 50.2 | 4077 | Low Flash Flooding |
| 70 | Sylhet | Habiganj | Nabiganj | A | 9.7 | 9 | 23989 | 2,473 | 50.9 | 4381 | Severe Flash Flooding |
| 71 | Sylhet | Habiganj | Shayestaganj | A | 6.35 | 9 | 23314 | 3,671 | 57.5 | 4513 | Severe Flash Flooding |
| 72 | Mymensingh | Jamalpur | Jamalpur | A | 53.28 | 12 | 142764 | 2,718 | 62.1 | 35619 | Low river flooding |
| 73 | Mymensingh | Jamalpur | Melandaha | A | 12.95 | 9 | 31,320 | 2,418.53 | 45.7 | 7615 | Moderate tidal surge |
| 74 | Khulna | Jashore | Benapole | A | 11.15 | 9 | 36524 | 3,275.70 | 56.9 | 8563 | Low river flooding |
| 75 | Khulna | Jashore | Jashore | A | 14.71 | 9 | 237478 | 8,315 | 76.7 | 54496 | Low river flooding |
| 76 | Khulna | Jashore | Keshabpur | A | 12.41 | 9 | 26229 | 2,114 | 63 | 6330 | Low river flooding |
| 77 | Khulna | Jashore | Noapara | A | 25.11 | 9 | 85856 | 3,419 | 63.7 | 21267 | Low river flooding |
| 78 | Barishal | Jhalokathi | Jhalokathi | A | 16.13 | 9 | 54029 | 3,350 | 77.9 | 12399 | Moderate tidal surge |
| 79 | Khulna | Jhenaidah | Jhenaidaha | A | 44.33 | 9 | 107834 | 2,494 | 67.2 | 25286 | Low river flooding |
| 80 | Khulna | Jhenaidah | Kaliganj | A | 15.89 | 9 | 45341 | 2,853 | 65.1 | 10637 | Low river flooding |
| 81 | Khulna | Jhenaidah | Kotchandpur | A | 17.04 | 9 | 33094 | 1,942 | 62.3 | 7943 | Low river flooding |
| 82 | Khulna | Jhenaidah | Maheshpur | A | 21.27 | 9 | 27670 | 1,301 | 53.6 | 6687 | Low river flooding |
| 83 | Khulna | Jhenaidah | Shailkupa | A | 20.92 | 9 | 35271 | 1,686 | 54.1 | 8507 | Low river flooding |
| 84 | Rajshahi | Joypurhat | Akkelpur | A | 15.99 | 9 | 24227 | 1,515 | 63.2 | 6281 | Not Flood prone |
| 85 | Rajshahi | Joypurhat | Kalai | A | 13.11 | 9 | 16464 | 1,256 | 54 | 4411 | Not Flood prone |
| 86 | Rajshahi | Joypurhat | Panchbibi | A | 9.63 | 9 | 22475 | 2,334 | 69.4 | 5510 | Not Flood prone |
| 87 | Rajshahi | Joypurhat | Joypurhat | A | 18.55 | 9 | 69033 | 3,721 | 77.9 | 16843 | Not Flood prone |
| 88 | Chattogram | Khagrchhari | Khagrachhari | A | 13.05 | 9 | 47278 | 3,623 | 71 | 10247 | Not Flood prone |
| 89 | Khulna | Khulna | Paikgachha | A | 5.53 | 9 | 16017 | 2,896 | 65.9 | 3788 | Severe tidal surge |
| 90 | Dhaka | Kishoreganj | Bhairab | A | 15.71 | 9 | 118992 | 7,574 | 53.6 | 24057 | Moderate river Flooding |
| 91 | Dhaka | Kishoreganj | Kishoreganj | A | 11.3 | 9 | 103798 | 9,186 | 72.5 | 21879 | Low river flooding |
| 92 | Rangpur | Kurigram | Kurigram | A | 27.04 | 9 | 77252 | 2,857 | 63.2 | 17159 | Moderate river Flooding |
| 93 | Rangpur | Kurigram | Nageswari | A | 42 | 9 | 62289 | 1,483 | 49.7 | 15298 | Moderate river Flooding |
| 94 | Khulna | Kushtia | Kumarkhali | A | 10.5 | 9 | 21914 | 2,087 | 63.6 | 5276 | Moderate river Flooding |
| 95 | Khulna | Kushtia | Kushtia | A | 13.32 | 9 | 102988 | 7,732 | 74.8 | 23037 | Moderate river Flooding |
| 96 | Rangpur | Lalmonirhat | Lalmonirhat | A | 17.62 | 9 | 60322 | 3,423 | 66 | 13897 | Moderate river Flooding |
| 97 | Rangpur | Lalmonirhat | Patgram | A | 12.49 | 9 | 30565 | 2,447 | 49.7 | 6379 | Low river flooding |
| 98 | Chattogram | Laxmipur | Laxmipur | A | 19.42 | 9 | 83112 | 4,280 | 63.9 | 17009 | Low river flooding |
| 99 | Chattogram | Laxmipur | Raipur | A | 10.02 | 9 | 30756 | 3,069 | 60.8 | 6593 | Low river flooding |
| 100 | Chattogram | Laxmipur | Ramganj | A | 26.16 | 9 | 44775 | 1,712 | 63.1 | 9055 | Low river flooding |
| 101 | Dhaka | Madaripur | Kalkini | A | 27.78 | 9 | 41608 | 1,498 | 55.3 | 8815 | Moderate river Flooding |
| 102 | Dhaka | Madaripur | Madaripur | A | 14.22 | 9 | 62690 | 4,409 | 73.1 | 14112 | Moderate river Flooding |
| 103 | Dhaka | Madaripur | Shibchar | A | 8.02 | 9 | 24154 | 3,012 | 65.9 | 5527 | Moderate river Flooding |
| 104 | Khulna | Magura | Magura | A | 43.92 | 9 | 98355 | 2,239 | 66 | 22105 | Moderate river Flooding |
| 105 | Dhaka | Manikganj | Manikganj | A | 23.14 | 9 | 71698 | 3,098 | 69.1 | 16459 | Low river flooding |
| 106 | Khulna | Meherpur | Meherpur | A | 16.9 | 9 | 25500 | 1,509 | 66.3 | 6488 | Low river flooding |
| 107 | Sylhet | Moulvibazar | Kulaura | A | 11.25 | 9 | 26150 | 2,324 | 65.5 | 4993 | Not Flood prone |
| 108 | Sylhet | Moulvibazar | Moulvibazar | A | 10.36 | 9 | 56537 | 5,457 | 65 | 10840 | Not Flood prone |
| 109 | Sylhet | Moulvibazar | Sreemongal | A | 2.3 | 9 | 23031 | 10,013 | 66.5 | 4825 | Not Flood prone |
| 110 | Dhaka | Munshiganj | Mirkadim | A | 2.87 | 9 | 44145 | 15,382 | 58.9 | 9912 | Moderate river Flooding |
| 111 | Dhaka | Munshiganj | Munshiganj | A | 2.87 | 9 | 44145 | 15,382 | 58.9 | 9912 | Moderate river Flooding |
| 112 | Mymensingh | Mymensingh | Bhaluka | A | 10.04 | 9 | 38774 | 3,862 | 73.8 | 9787 | Not Flood prone |
| 113 | Mymensingh | Mymensingh | Gafargaon | A | 5.39 | 9 | 29325 | 5,441 | 67.7 | 6513 | Low river flooding |
| 114 | Mymensingh | Mymensingh | Phulpur | A | 8.8 | 9 | 25570 | 2,906 | 64.7 | 5583 | Low river flooding |
| 115 | Mymensingh | Mymensingh | Ishwarganj | A | 12.41 | 9 | 28631 | 2,307 | 58 | 5917 | Not Flood prone |
| 116 | Mymensingh | Mymensingh | Muktagacha | A | 12.57 | 9 | 49915 | 3,971 | 60.2 | 11189 | Low river flooding |
| 117 | Mymensingh | Mymensingh | Phulpur | A | 10.1 | 9 | 25628 | 2,537 | 53.9 | 5774 | Low river flooding |
| 118 | Mymensingh | Mymensingh | Trishal | A | 15.48 | 9 | 34747 | 2,245 | 61 | 7202 | Not Flood prone |
| 119 | Rajshahi | Naogaon | Naogaon | A | 37.08 | 9 | 150549 | 4,060 | 65.1 | 35923 | Not Flood prone |
| 120 | Rajshahi | Naogaon | Nazipur | A | 11.82 | 9 | 21670 | 1,833 | 69.6 | 5315 | Low river flooding |
| 121 | Khulna | Narail | Narail | A | 26.9 | 9 | 42299 | 1,572 | 81.7 | 9945 | Moderate river Flooding |
| 122 | Dhaka | Narayanganj | Tarabo | A | 19.39 | 9 | 150709 | 7,773 | 58.7 | 38612 | Low river flooding |
| 123 | Dhaka | Narsingdi | Ghorashal | A | 25.37 | 9 | 85949 | 3,388 | 66.6 | 18868 | Low river flooding |
| 124 | Dhaka | Narsingdi | Madhabdi | A | 5.1 | 9 | 49583 | 9,722 | 63.9 | 11323 | Low river flooding |
| 125 | Dhaka | Narsingdi | Narsingdi | A | 14.75 | 9 | 185128 | 40,661 | 64.4 | 8837 | Low river flooding |
| 126 | Rajshahi | Natore | Banpara | A | 9.06 | 9 | 9975 | 1,101 | 62.1 | 2557 | Not Flood prone |
| 127 | Rajshahi | Natore | Gurudaspur | A | 13.61 | 9 | 32807 | 2,411 | 54.6 | 8287 | Low river flooding |
| 128 | Rajshahi | Natore | Natore | A | 14.84 | 9 | 81203 | 5,472 | 73 | 18828 | Not Flood prone |
| 129 | Rajshahi | Natore | Singra | A | 29.39 | 9 | 33192 | 1,129 | 56.8 | 7955 | Low river flooding |
| 130 | Mymensingh | Netrokona | Mohanganj | A | 6.97 | 9 | 27193 | 3,901 | 65.8 | 5786 | Low river flooding |
| 131 | Mymensingh | Netrokona | Netrokona | A | 29.39 | 9 | 91936 | 3,128 | 67.1 | 19627 | Low river flooding |
| 132 | Rangpur | Nilphamari | Nilphamari | A | 9.42 | 9 | 17027 | 1,808 | 64.2 | 4011 | Not Flood prone |
| 133 | Rangpur | Nilphamari | Saidpur | A | 24.88 | 9 | 133433 | 4,442 | 63.9 | 27515 | Not Flood prone |
| 134 | Chattogram | Noakhali | Basurhat | A | 6.85 | 9 | 29877 | 4,362 | 62.5 | 5512 | Severe tidal flooding |
| 135 | Chattogram | Noakhali | Chatkhil | A | 13.81 | 9 | 31395 | 2,273 | 70.1 | 6084 | Low river flooding |
| 136 | Chattogram | Noakhali | Choumuhani | A | 14.48 | 9 | 132948 | 3,745 | 63.6 | 24091 | Low river flooding |
| 137 | Chattogram | Noakhali | Noakhali | A | 16.67 | 9 | 107654 | 6,458 | 75.3 | 20222 | Low river flooding |
| 138 | Chattogram | Noakhali | Sonaimuri | A | 13.11 | 9 | 34218 | 2,610 | 62 | 6162 | Low river flooding |
| 139 | Rajshahi | Pabna | Bhangura | A | 5.13 | 9 | 20606 | 4,017 | 56.6 | 4712 | Moderate river Flooding |
| 140 | Rajshahi | Pabna | Chatmohar | A | 3.28 | 9 | 14443 | 4,403 | 76.3 | 3377 | Moderate river Flooding |
| 141 | Rajshahi | Pabna | Faridpur | A | 9.63 | 9 | 14010 | 1,455 | 56 | 3203 | Moderate river Flooding |
| 142 | Rajshahi | Pabna | Bera | A | 16.42 | 9 | 50068 | 3,049 | 52.2 | 11012 | Moderate river Flooding |
| 143 | Rajshahi | Pabna | Ishwardi | A | 19.59 | 9 | 66255 | 3,382 | 65.2 | 15332 | Low river flooding |
| 144 | Rajshahi | Pabna | Pabna | A | 27.27 | 15 | 144442 | 5,297 | 76.2 | 33217 | Low river flooding |
| 145 | Rajshahi | Pabna | Santhia | A | 26.29 | 9 | 38704 | 1,472 | 47.9 | 9319 | Moderate river Flooding |
| 146 | Rajshahi | Pabna | Suzanagar | A | 11.08 | 9 | 25461 | 2,298 | 44.6 | 5833 | Severe river Flooding |
| 147 | Rangpur | Panchagarh | Panchagarh | A | 20.72 | 9 | 45589 | 2,200 | 70.3 | 10105 | Low Flash Flooding |
| 148 | Barishal | Patuakhali | Bauphal | A | 7.96 | 9 | 11435 | 1,437 | 79.9 | 2538 | Moderate tidal surge |
| 149 | Barishal | Patuakhali | Galachipa | A | 3.39 | 9 | 21200 | 6,254 | 71.5 | 4967 | Severe tidal surge |
| 150 | Barishal | Patuakhali | Kalapara | A | 3.75 | 9 | 17332 | 4,622 | 75.1 | 4347 | Severe tidal surge |
| 151 | Barishal | Patuakhali | Patuakhali | A | 12.66 | 9 | 65000 | 5,134 | 75.8 | 13994 | Moderate tidal surge |
| 152 | Barishal | Pirojpur | Mathbaria | A | 4.01 | 9 | 18375 | 4,582 | 77.9 | 4330 | Severe tidal surge |
| 153 | Barishal | Pirojpur | Pirojpur | A | 29.49 | 9 | 60056 | 2,036 | 77.8 | 13646 | Moderate tidal surge |
| 154 | Barishal | Pirojpur | Swarupkathi | A | 4.98 | 9 | 20019 | 4,020 | 79.3 | 3985 | Moderate tidal surge |
| 155 | Dhaka | Rajbari | Goalanda | A | 4.85 | 9 | 18663 | 3,848 | 58.5 | 4156 | Severe river flooding |
| 156 | Dhaka | Rajbari | Pangsha | A | 12.57 | 9 | 29098 | 2,315 | 67.7 | 6569 | Moderate river Flooding |
| 157 | Dhaka | Rajbari | Rajbari | A | 11.65 | 9 | 56313 | 4,834 | 74.3 | 12657 | Moderate river Flooding |
| 158 | Rajshahi | Rajshahi | Bagha | A | 11.69 | 9 | 27623 | 2,363 | 55.4 | 7044 | Low river flooding |
| 159 | Rajshahi | Rajshahi | Charghat | A | 18.72 | 9 | 38409 | 2,052 | 62.1 | 9105 | Moderate river Flooding |
| 160 | Rajshahi | Rajshahi | Godagari | A | 14.29 | 9 | 39766 | 2,783 | 53 | 8008 | Moderate river Flooding |
| 161 | Rajshahi | Rajshahi | Kakonhat | A | 19.25 | 9 | 16569 | 861 | 44.4 | 3997 | Drought Prone |
| 162 | Rajshahi | Rajshahi | Naohata | A | 40.46 | 9 | 57119 | 1,412 | 56.5 | 14045 | Not Flood prone |
| 163 | Rajshahi | Rajshahi | Taherpur | A | 10.84 | 9 | 17944 | 1,655 | 54.4 | 4469 | Not Flood prone |
| 164 | Chattogram | Rangamati | Rangamati | A | 64.75 | 9 | 84000 | 1,297 | 73.1 | 18355 | Not Flood prone |
| 165 | Khulna | Satkhira | Satkhira | A | 32.39 | 9 | 113322 | 3,499 | 69.3 | 26896 | Moderate tidal surge |
| 166 | Dhaka | Shariatpur | Damuddya | A | 5.38 | 9 | 14242 | 2,647 | 64.5 | 3274 | Moderate river Flooding |
| 167 | Dhaka | Shariatpur | Shariatpur | A | 24.92 | 9 | 49535 | 1,988 | 62.5 | 10908 | Moderate river Flooding |
| 168 | Mymensingh | Sherpur | Sherpur | A | 46.9 | 9 | 126249 | 2,692 | 63.3 | 31470 | Not Flood prone |
| 169 | Rajshahi | Sirajganj | Belkuchi | A | 19 | 9 | 75364 | 3,967 | 49.6 | 16229 | Severe Flash Flooding |
| 170 | Rajshahi | Sirajganj | Shahjadpur | A | 11.07 | 9 | 64507 | 5,827 | 56.1 | 14226 | Moderate river Flooding |
| 171 | Rajshahi | Sirajganj | Sirajganj | A | 28.49 | 9 | 158913 | 5,578 | 63.2 | 35556 | Severe Flash Flooding |
| 172 | Rajshahi | Sirajganj | Ullapara | A | 12.07 | 9 | 47693 | 3,951 | 61.9 | 10526 | Low river Flooding |
| 173 | Sylhet | Sunamganj | Chhatak | A | 11.98 | 9 | 44364 | 3,703 | 55.6 | 7824 | Severe Flash Flooding |
| 174 | Sylhet | Sunamganj | Sunamganj | A | 17.31 | 9 | 65332 | 3,774 | 60.5 | 11926 | Severe Flash Flooding |
| 175 | Sylhet | Sylhet | Golapganj | A | 16.5 | 9 | 32444 | 1,966 | 62.2 | 5652 | Moderate river Flooding |
| 176 | Sylhet | Sylhet | Beanibazar | A | 12.39 | 9 | 42030 | 3,392 | 63.5 | 7709 | Not Flood prone |
| 177 | Dhaka | Tangail | Ghatail | A | 8.88 | 9 | 35245 | 3,969 | 72.1 | 7668 | Low river flooding |
| 178 | Dhaka | Tangail | Gopalpur | A | 23.15 | 9 | 50160 | 2,167 | 49.5 | 12539 | Low river flooding |
| 179 | Dhaka | Tangail | Madhupur | A | 25 | 9 | 56342 | 2,254 | 56.7 | 13713 | Not Flood prone |
| 180 | Dhaka | Tangail | Sakhipur | A | 13.77 | 9 | 30028 | 2,181 | 57.6 | 7473 | Not Flood prone |
| 181 | Dhaka | Tangail | Tangail | A | 33.8 | 18 | 167412 | 4,953 | 71.8 | 37607 | Low river flooding |
| 182 | Rangpur | Thakurgaon | Pirganj | A | 29.41 | 9 | 27700 | 942 | 53.8 | 6541 | Low Flash Flooding |
| 183 | Rangpur | Thakurgaon | Thakurgaon | A | 30.03 | 9 | 80589 | 2,684 | 74.3 | 18015 | Low Flash Flooding |
6.0 Reference :
- World Bank interactive poverty map Used 2010 Bangladesh Poverty Maps, the 2011 Census of Population and Housing sample available from the Integrated Public Use Microdata Series project (IPUMS), and the 2012 Undernutrition Maps of Bangladesh.
- The 2010 Bangladesh Poverty Maps technical report describing the metholody used to construct the zila and upazila national poverty statistics can be accessed at the following link:
- http://www.worldbank.org/en/news/feature/2014/09/30/poverty-maps
- The Population and Housing Census sample (IPUMS) dataset can be accessed at the following link: ) https://international.ipums.org/international-action/sample_details/country/bd
- The undernutrition maps produced by the World Food Program (WFP) are available at the following link: https://www.wfp.org/content/undernutrition-maps-bangladesh-2012
- Detailed information describing the construction of the variables and sources is presented below.
- Poverty (among the population):
- Poverty headcount ratio (%): Percentage of the population that lives below the official national upper poverty line.
- Extreme poverty headcount ratio (%): Percentage of the population that lives below the official national lower poverty line.
- Percentage of population in bottom 40%: Percentage of the population in the zila/upazila that belongs to the bottom 40% of the national real per capita consumption distribution.
Source: Indicators 5, 6, and 7 come from 2010 Bangladesh Poverty Maps. The total number of poor, extreme poor, and population that belongs to the bottom 40% were computed using indicators 5, 6, 7 and indicator 1 (Total population in the zila/upazila).
3. Primary Employment (among working population):
- Employment in Agriculture: If employed, sector of employment is agriculture.
- Employment in Industry: If employed, sector of employment is industry.
- Employment in Services: If employed, sector of employment is services.
Source: Indicators 16, 17, and 18 were constructed using Question 25 from the 2011 Census of Population and Housing. Question 25 was asked for persons 7 years of age and older who reported being employed. Question. If employed, field of employment 1) Agriculture , (2) Industry, 3) Service
GIZ NCVA (nationwide climate vulnerability assessment in Bangladesh) , Dec 2018,
- National Water Rescue Database ( NWRD, 2011), Bangladesh Delta Plan(BDP) 2100, CEGIS
Please contact for conducting Urban Risk and Vulnerability Assessment of your country at WhatsApp + 88 01711979179 , Skype: zmsajjad, Email : zmsajjad@yahoo.com
One Response
Please contact for conducting Urban Risk and Vulnerability Assessment for Urban Centers of your country
Leave a Reply